|
MMiRNA-Viewer A Data Visulization Tool Built to Render the Relationship Between microRNAs and mRNAs. |
Tools | Tutorial | About | Home |
|
MMiRNA-Viewer A Data Visulization Tool Built to Render the Relationship Between microRNAs and mRNAs. |
Tools | Tutorial | About | Home |
The MMiRNA-Viewer is a bioinformatics tool used to visualize the complex interactions between miRNA and mRNA across two different experimental conditions. This tool can take user specified miRNA and mRNA interactions as well as our sample input data sets provided by the Cancer Genome Atlas (TCGA).
At the top of the page there is a button for selecting an input data set, this will take you to a file explorer view where you can select a single file for upload. The following is the format for the input data set. The file should be a text (.txt) file. The tools section includes a link to a conversion tool for most miRNA naming conventions.

For example:

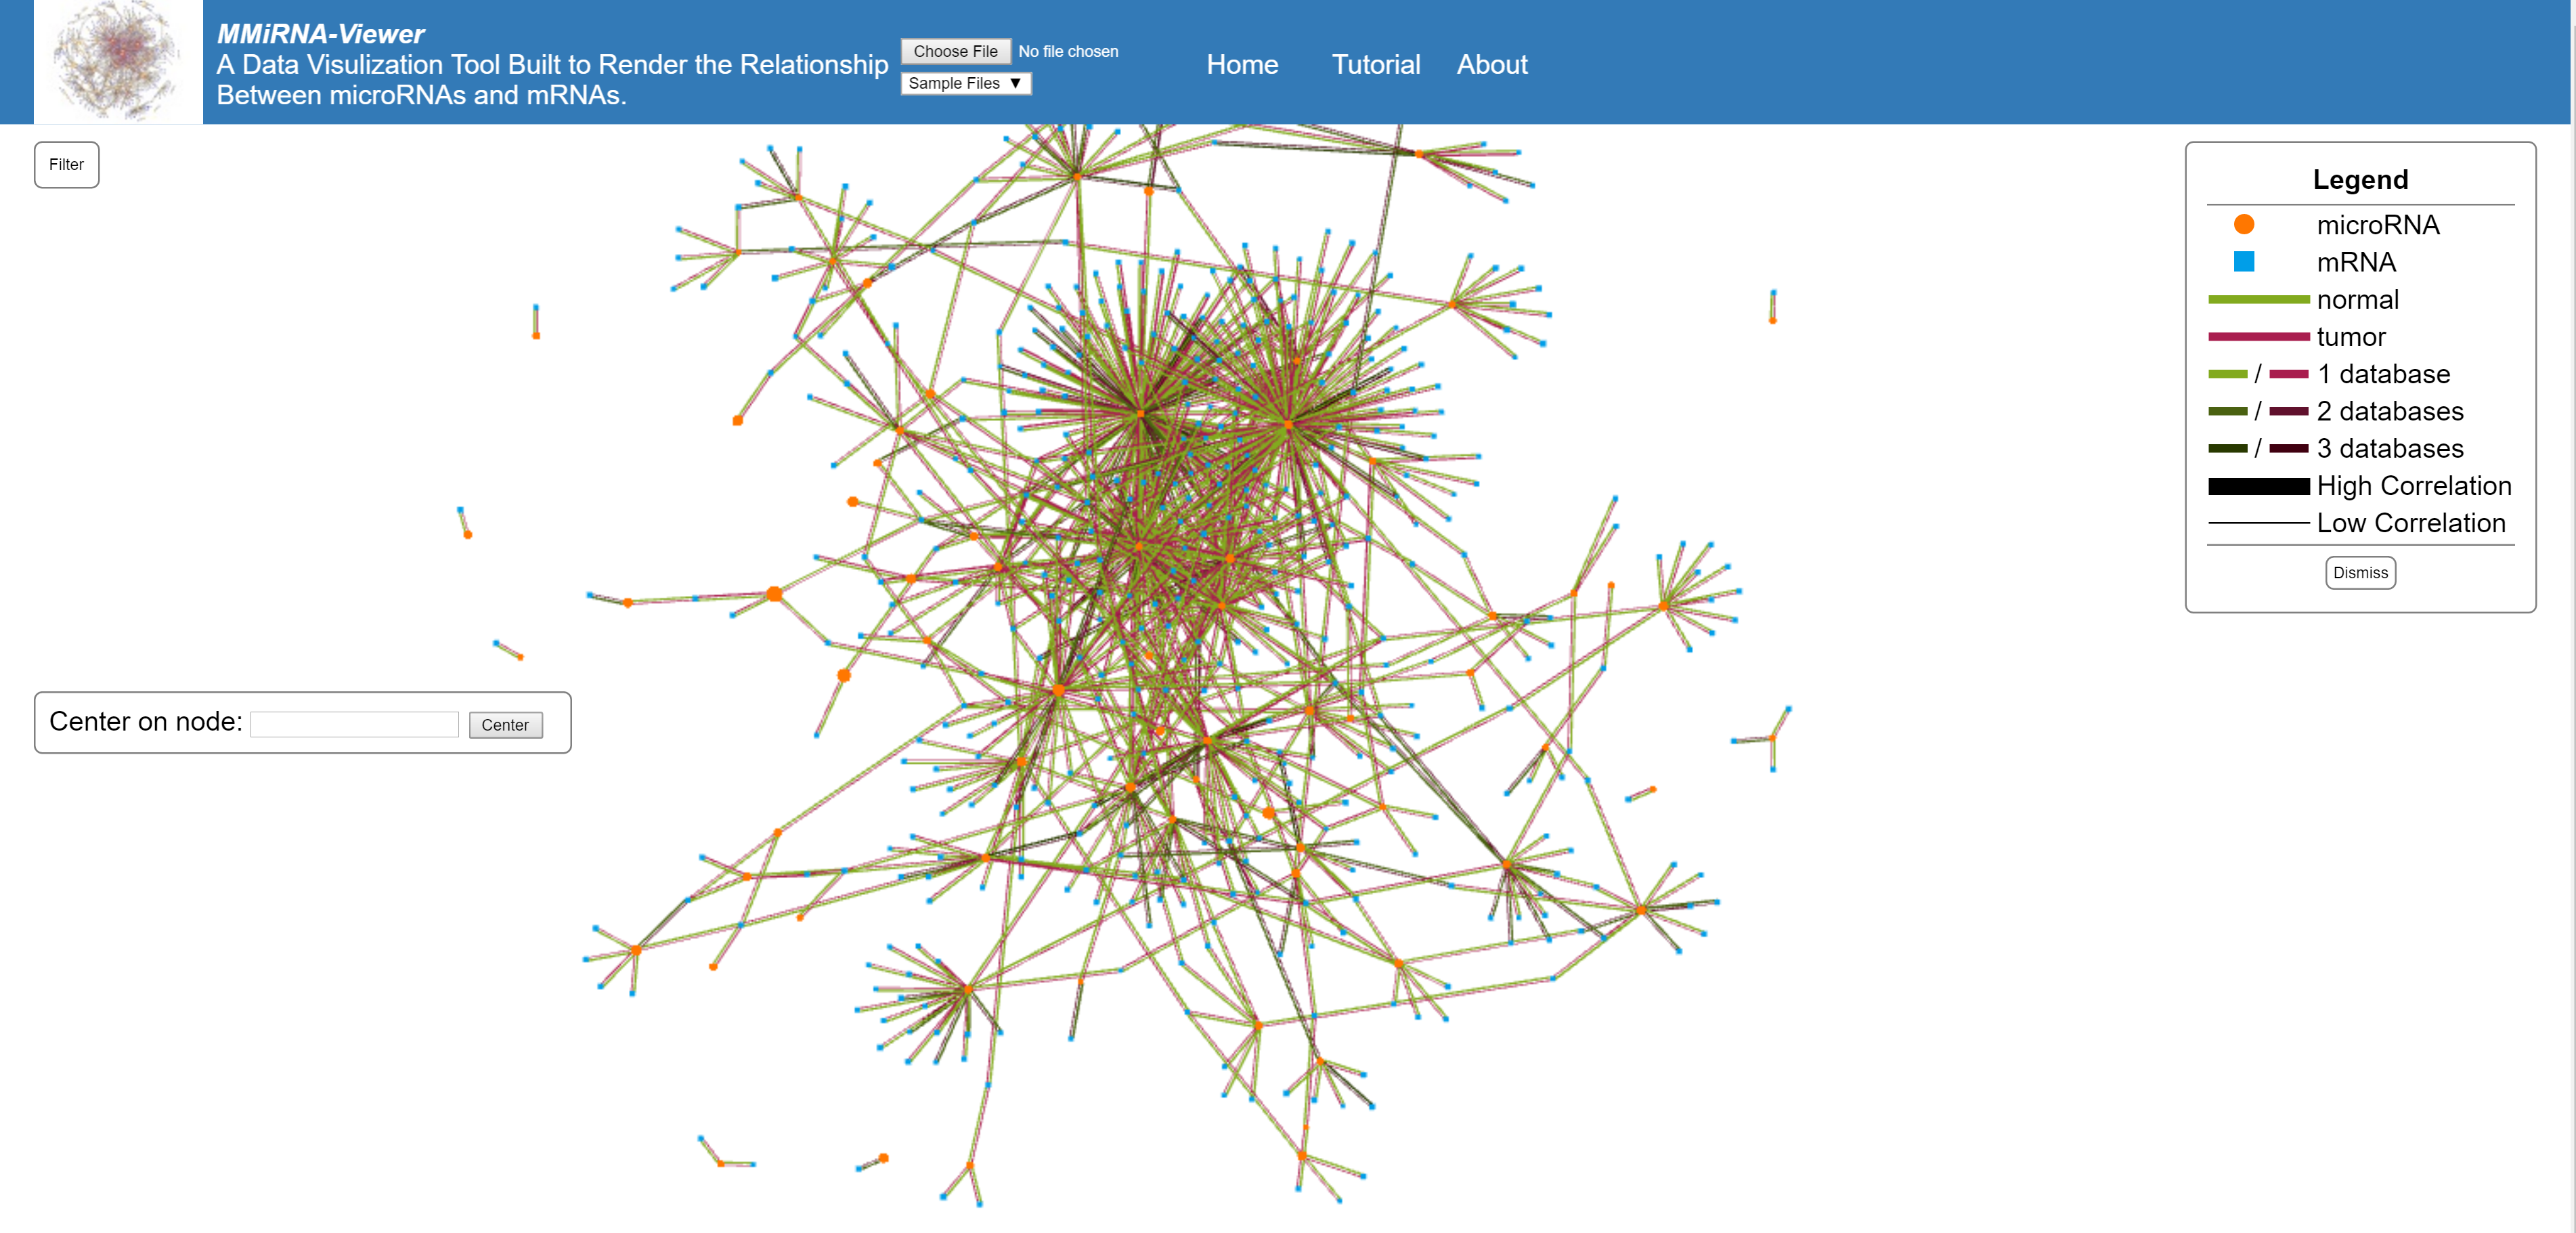
This graph is an interactive representation of the clusters of miRNA and mRNA interactions, individual nodes can be selected and moved using the mouse.
Drag any node on the graph by clicking and holding down your mouse. Right click to anchor a node to a new area of the graph. Zoom using your mouse's scroll wheel.
Each node is sized depending on their expression values (the larger the node, the larger the expression). Circular nodes are mRNA and square nodes are miRNA. Clicking on a node will display the given information, clicking on a second adjacent node will display the information about their relationship. Two lines are displayed between each node, the red represents the tumor connection and the green represents the normal connection. The lighter colored lines represent more database predictions and the size of the line represents the strength of correlations between each nodes (all of this is explained in the legend on the top right of the screen).
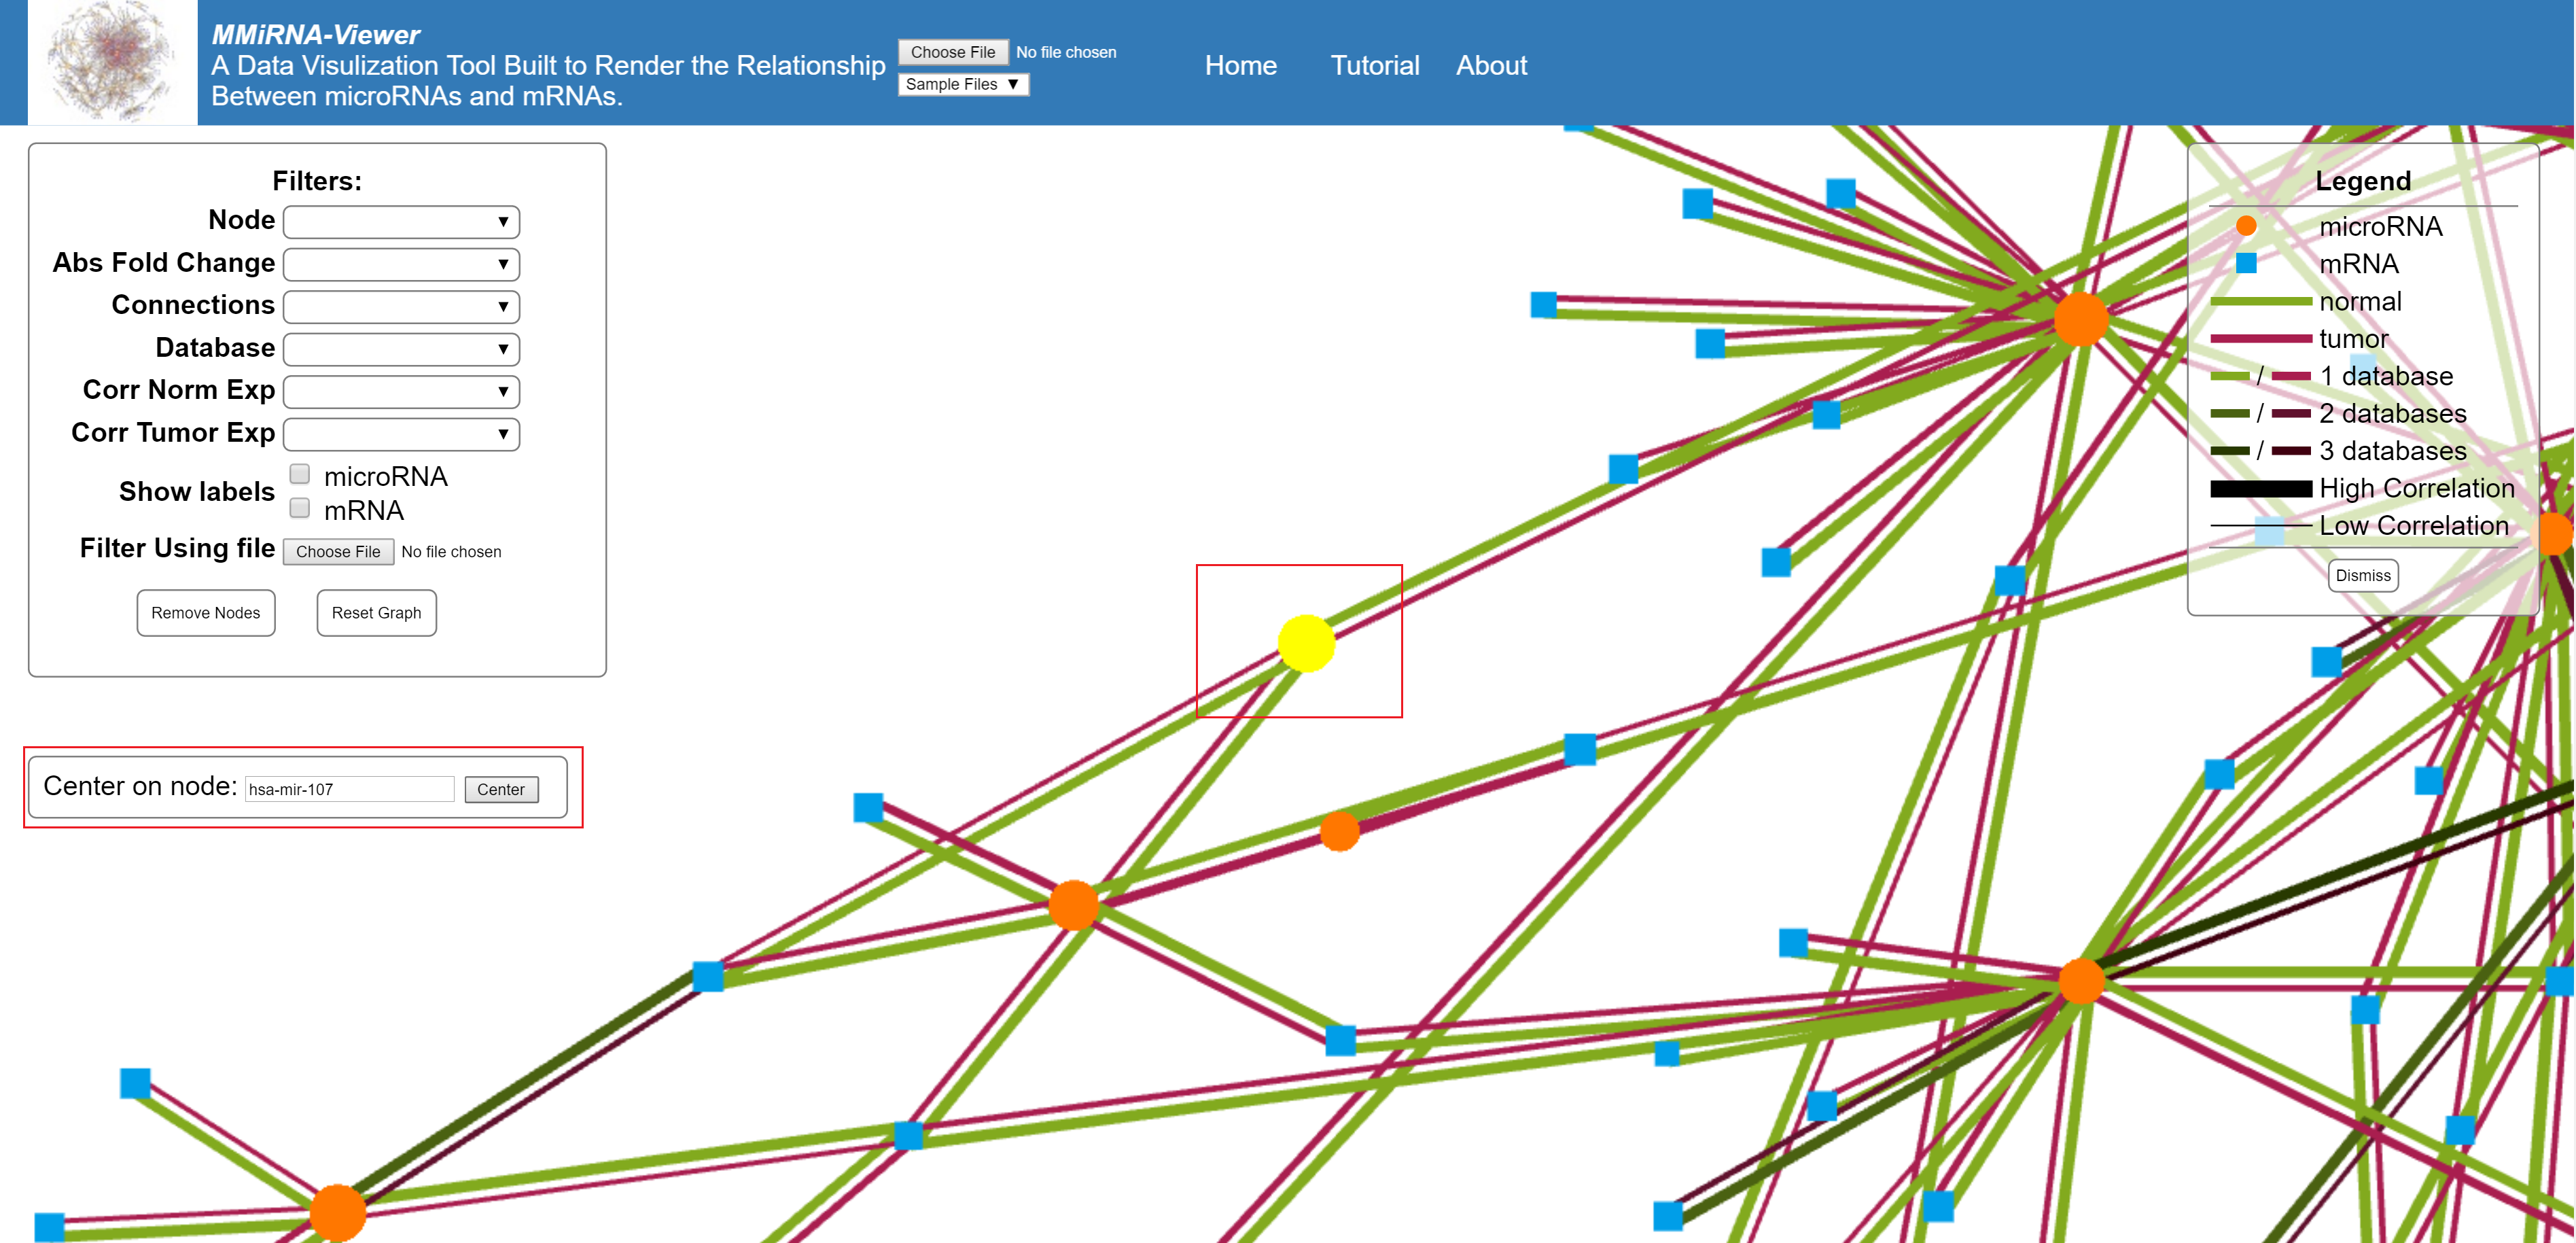
This feature allows you to search the graph for a specific mRNA or miRNA, if found the view will center on that node.
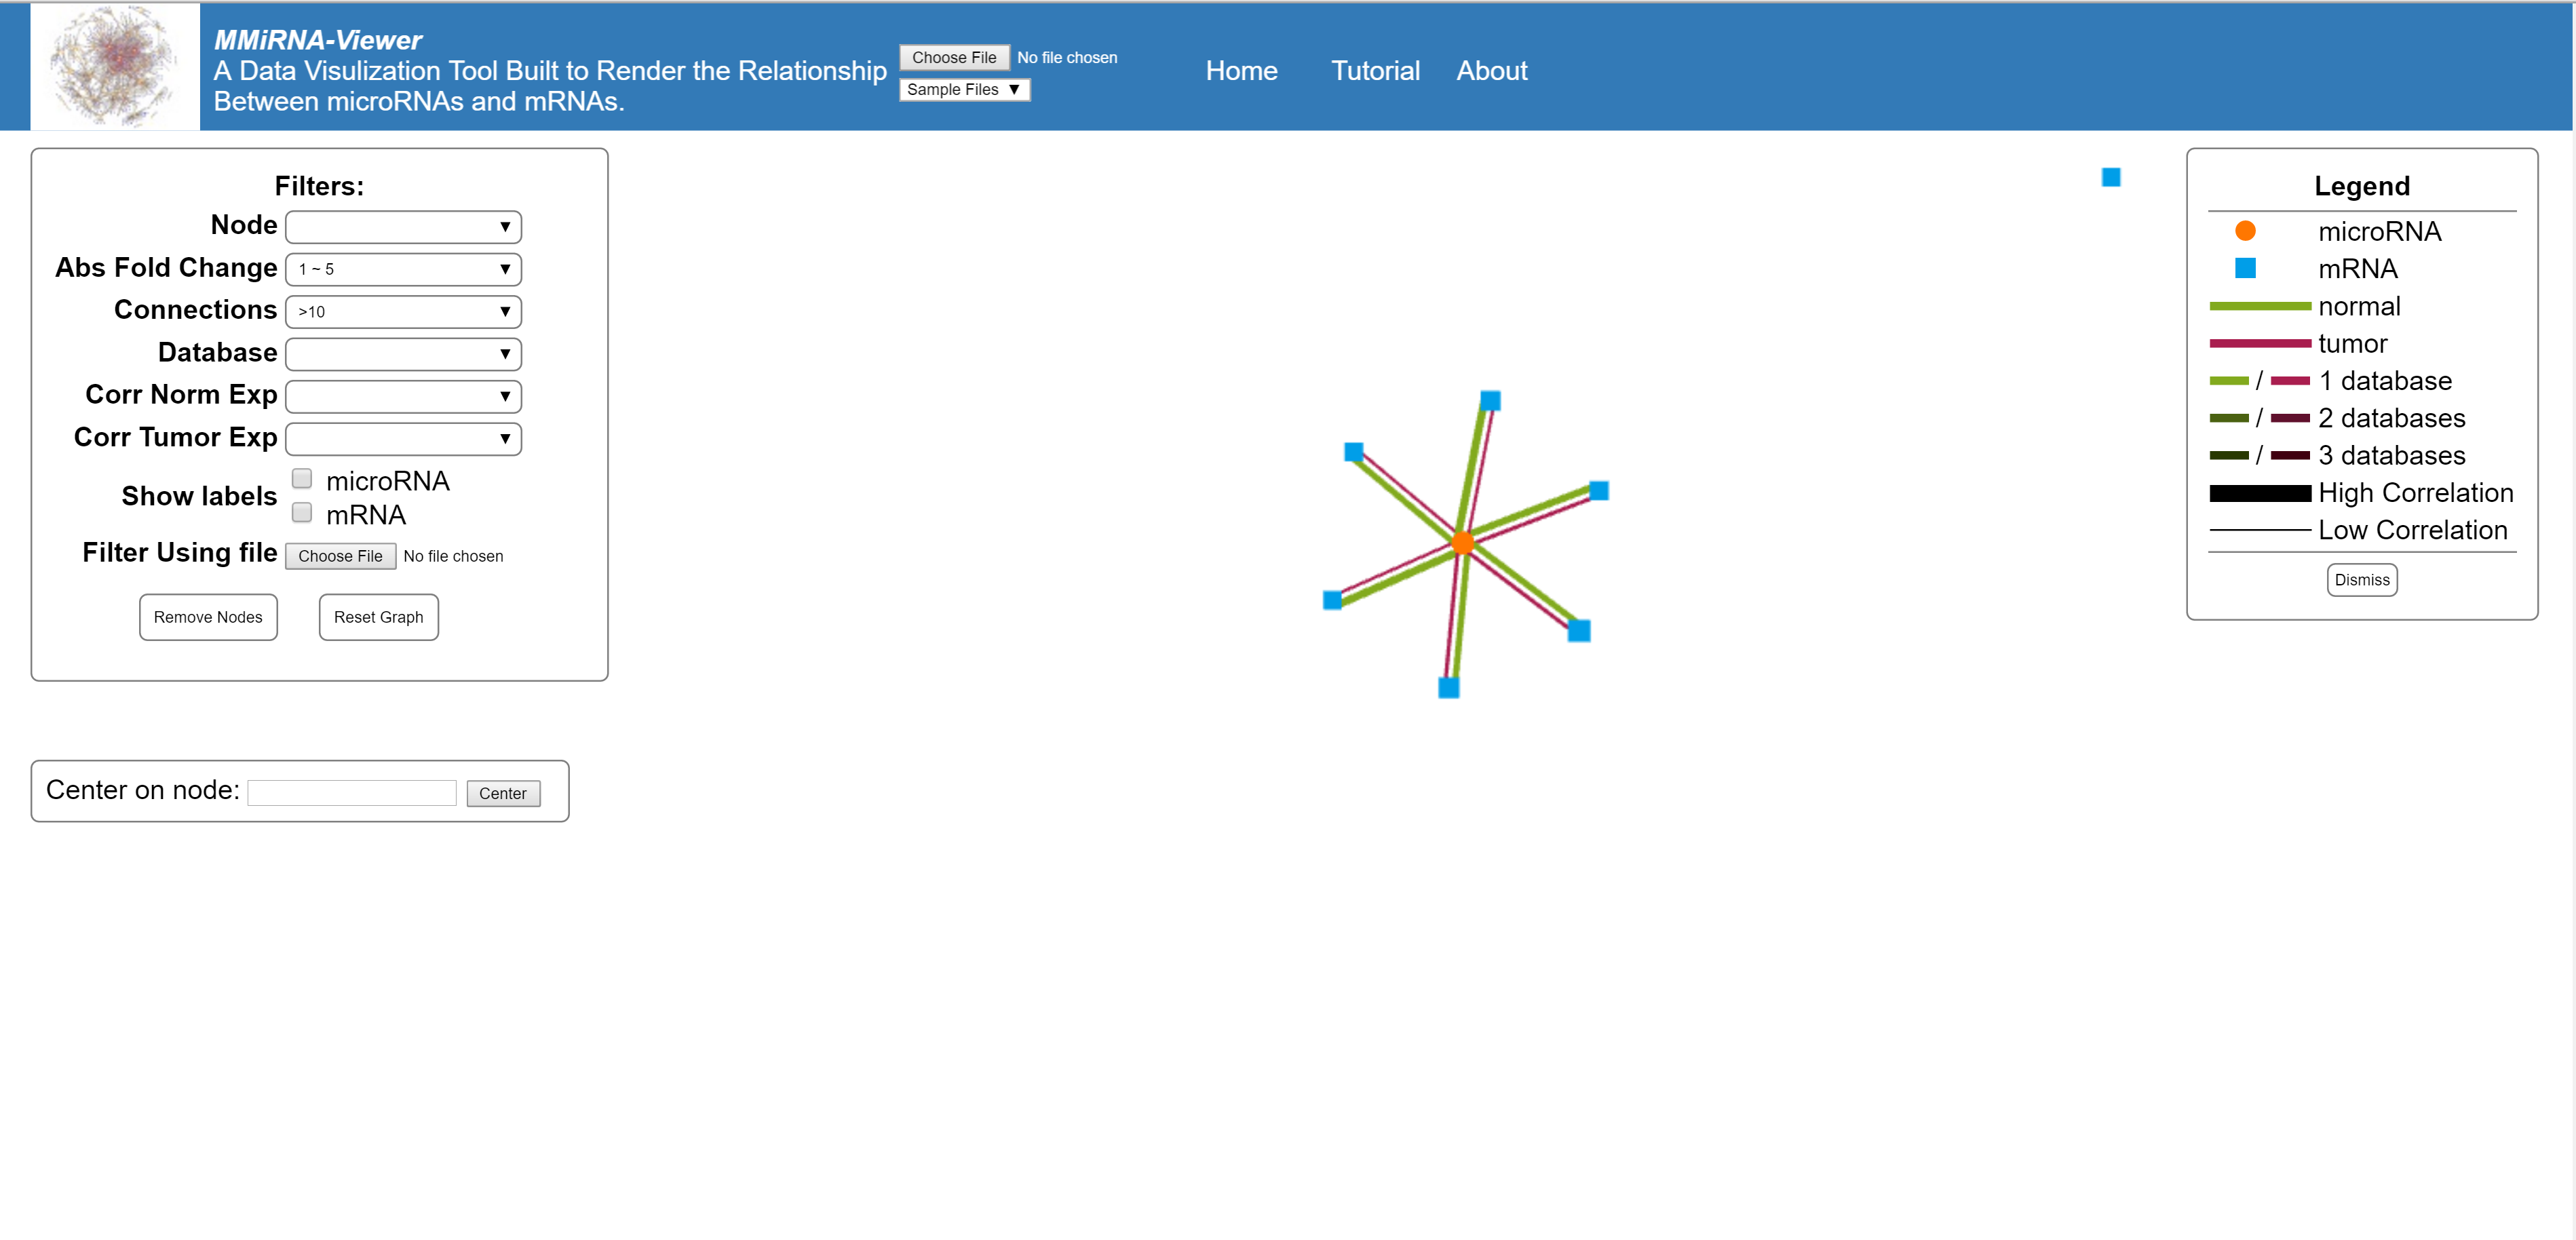
In the upper left corner of the screen is the filter options for the present graph. The selection of a filter will change the graph temporarily. Once you choose your filters use the remove Nodes button to get rid of non selected nodes. If you need to retrieve the removed data, the reset graph button will restore all nodes to the graph.
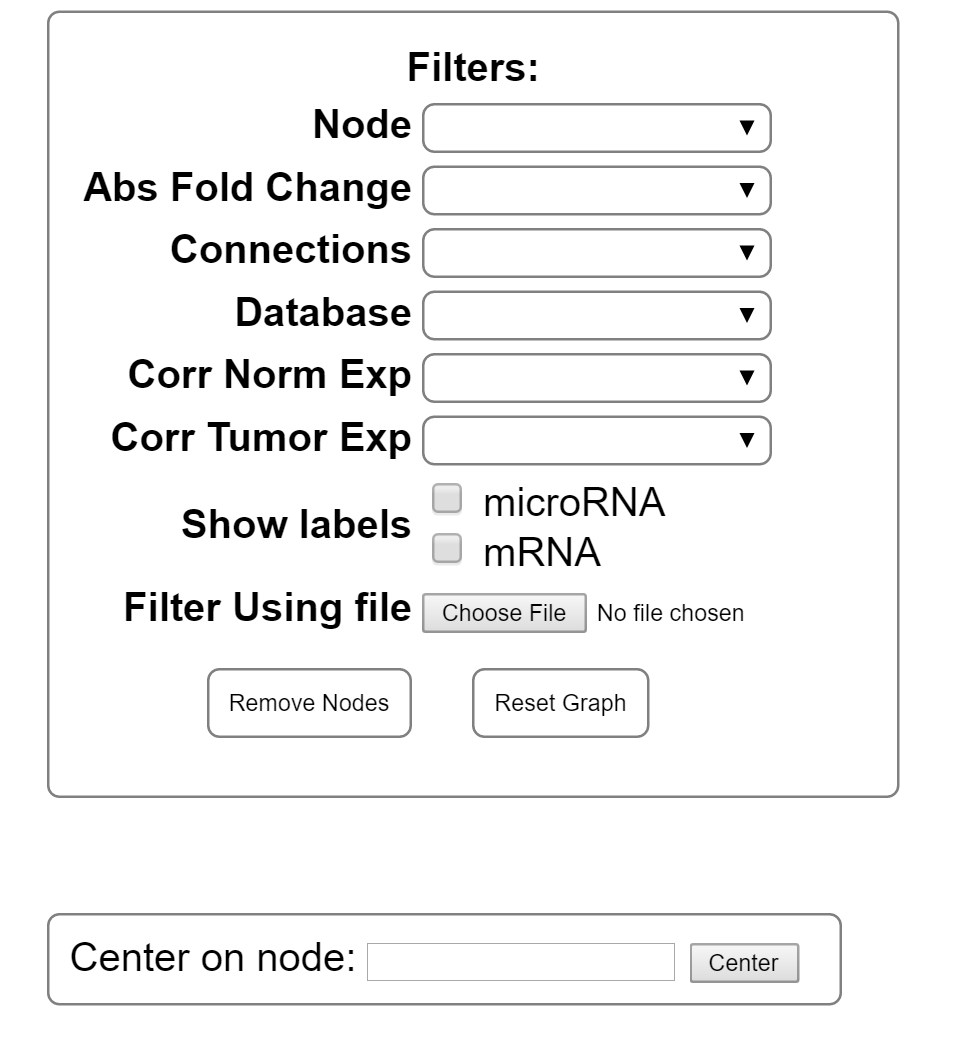
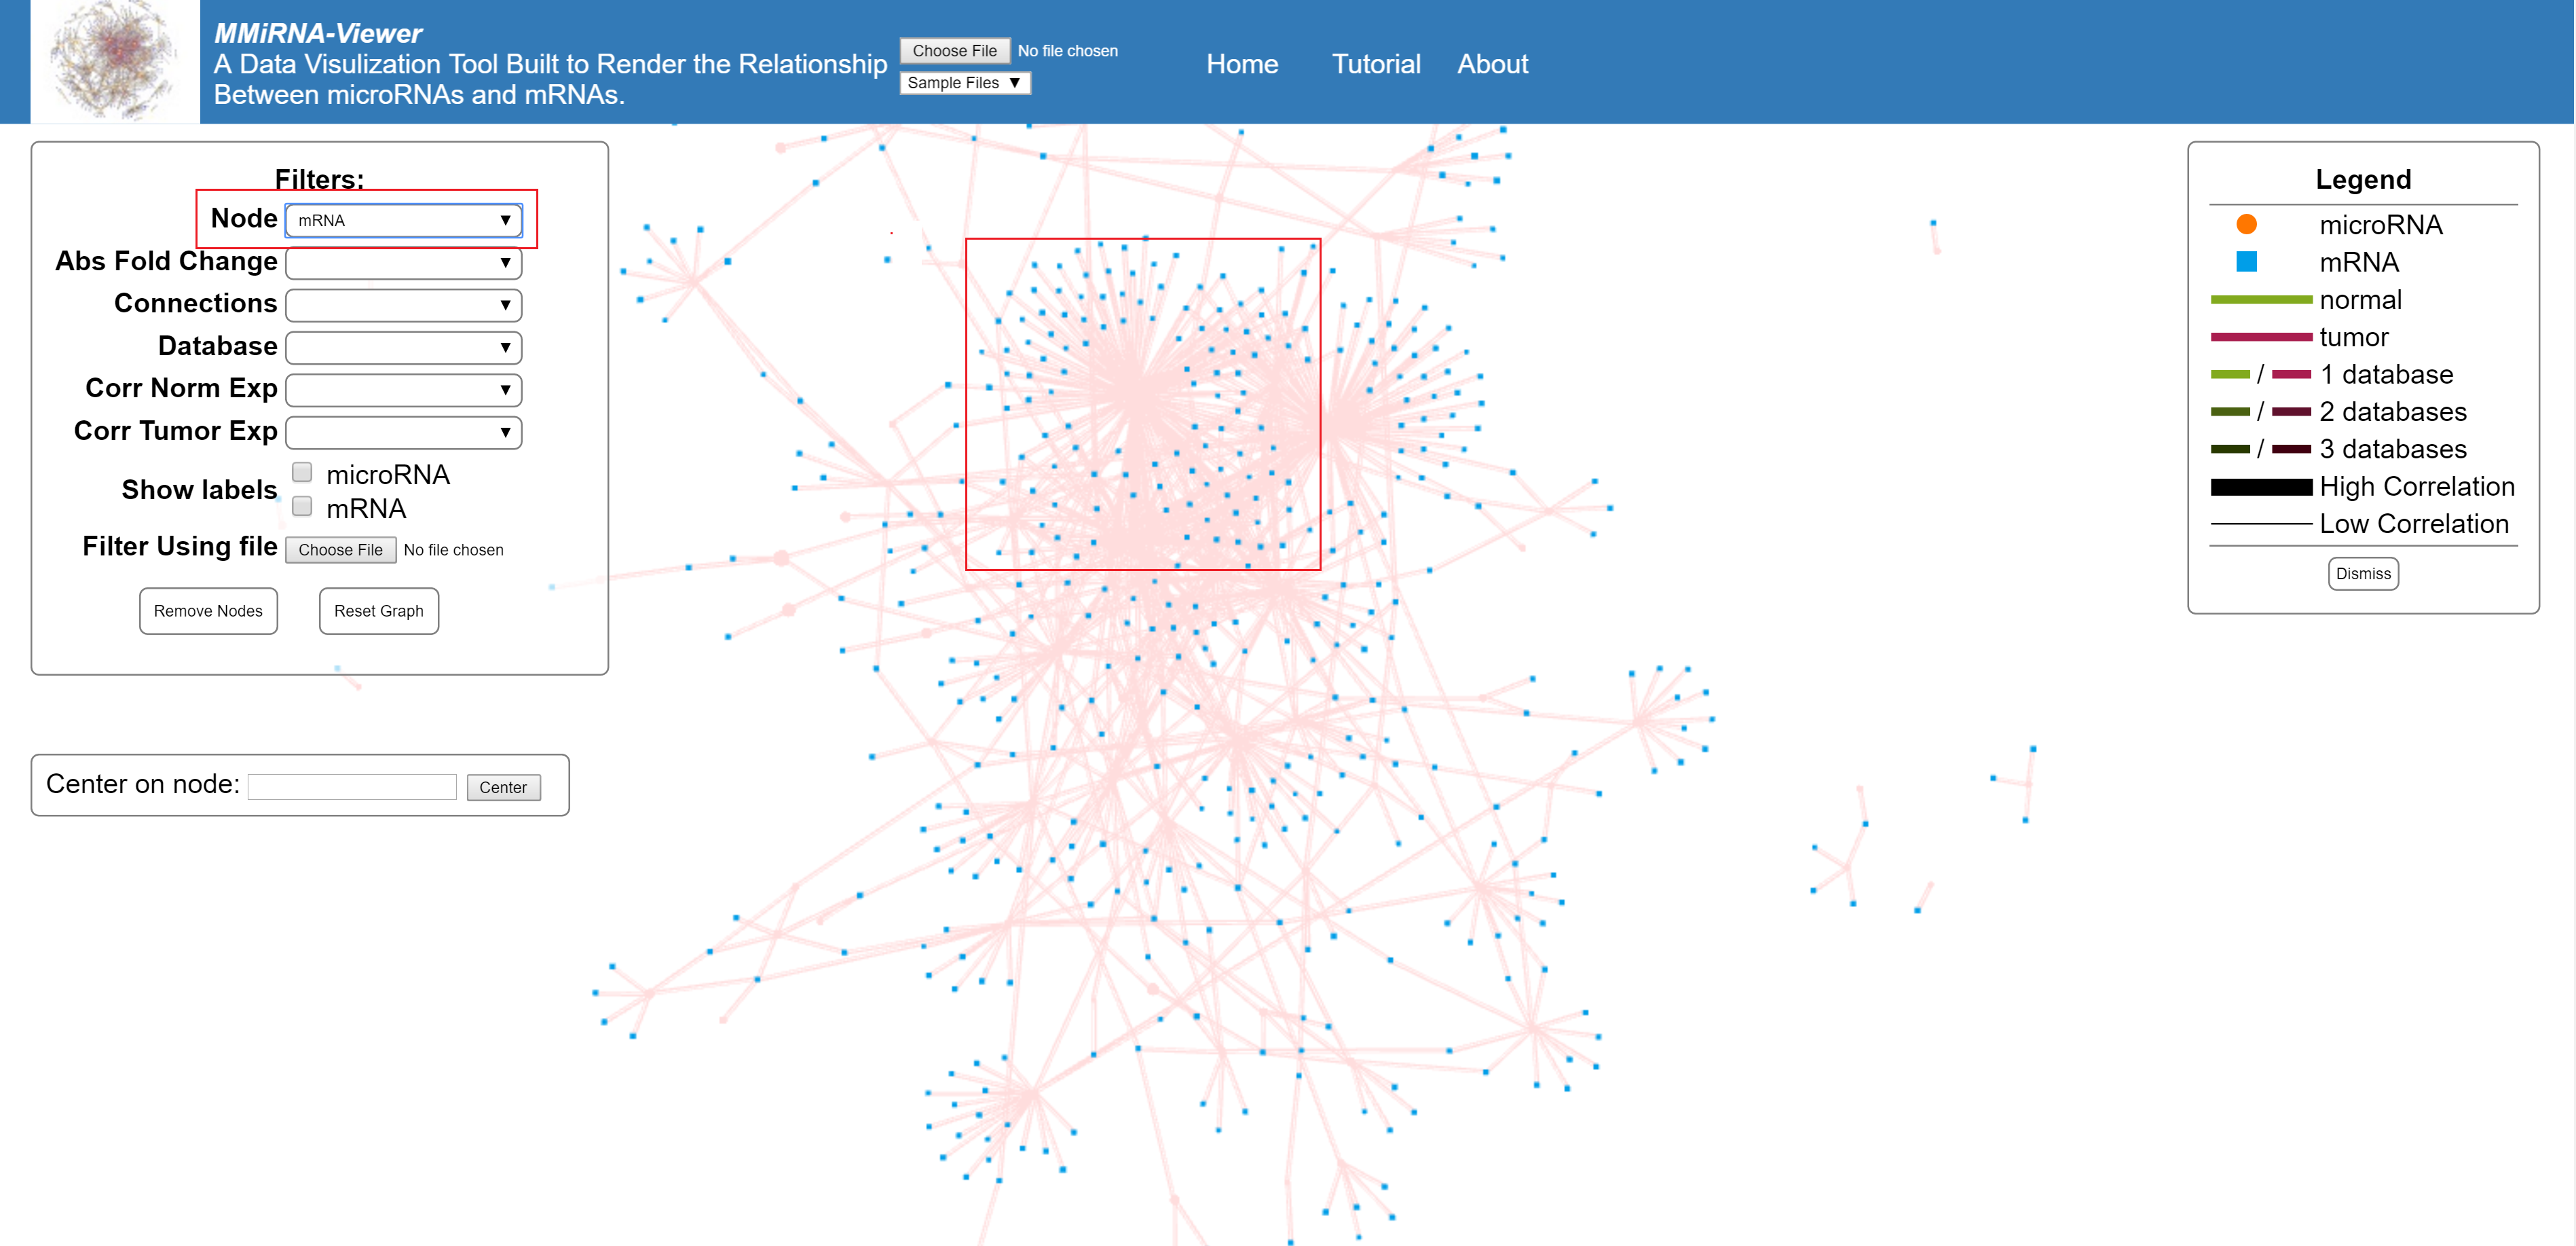
Filter to show only mRNA or only miRNA
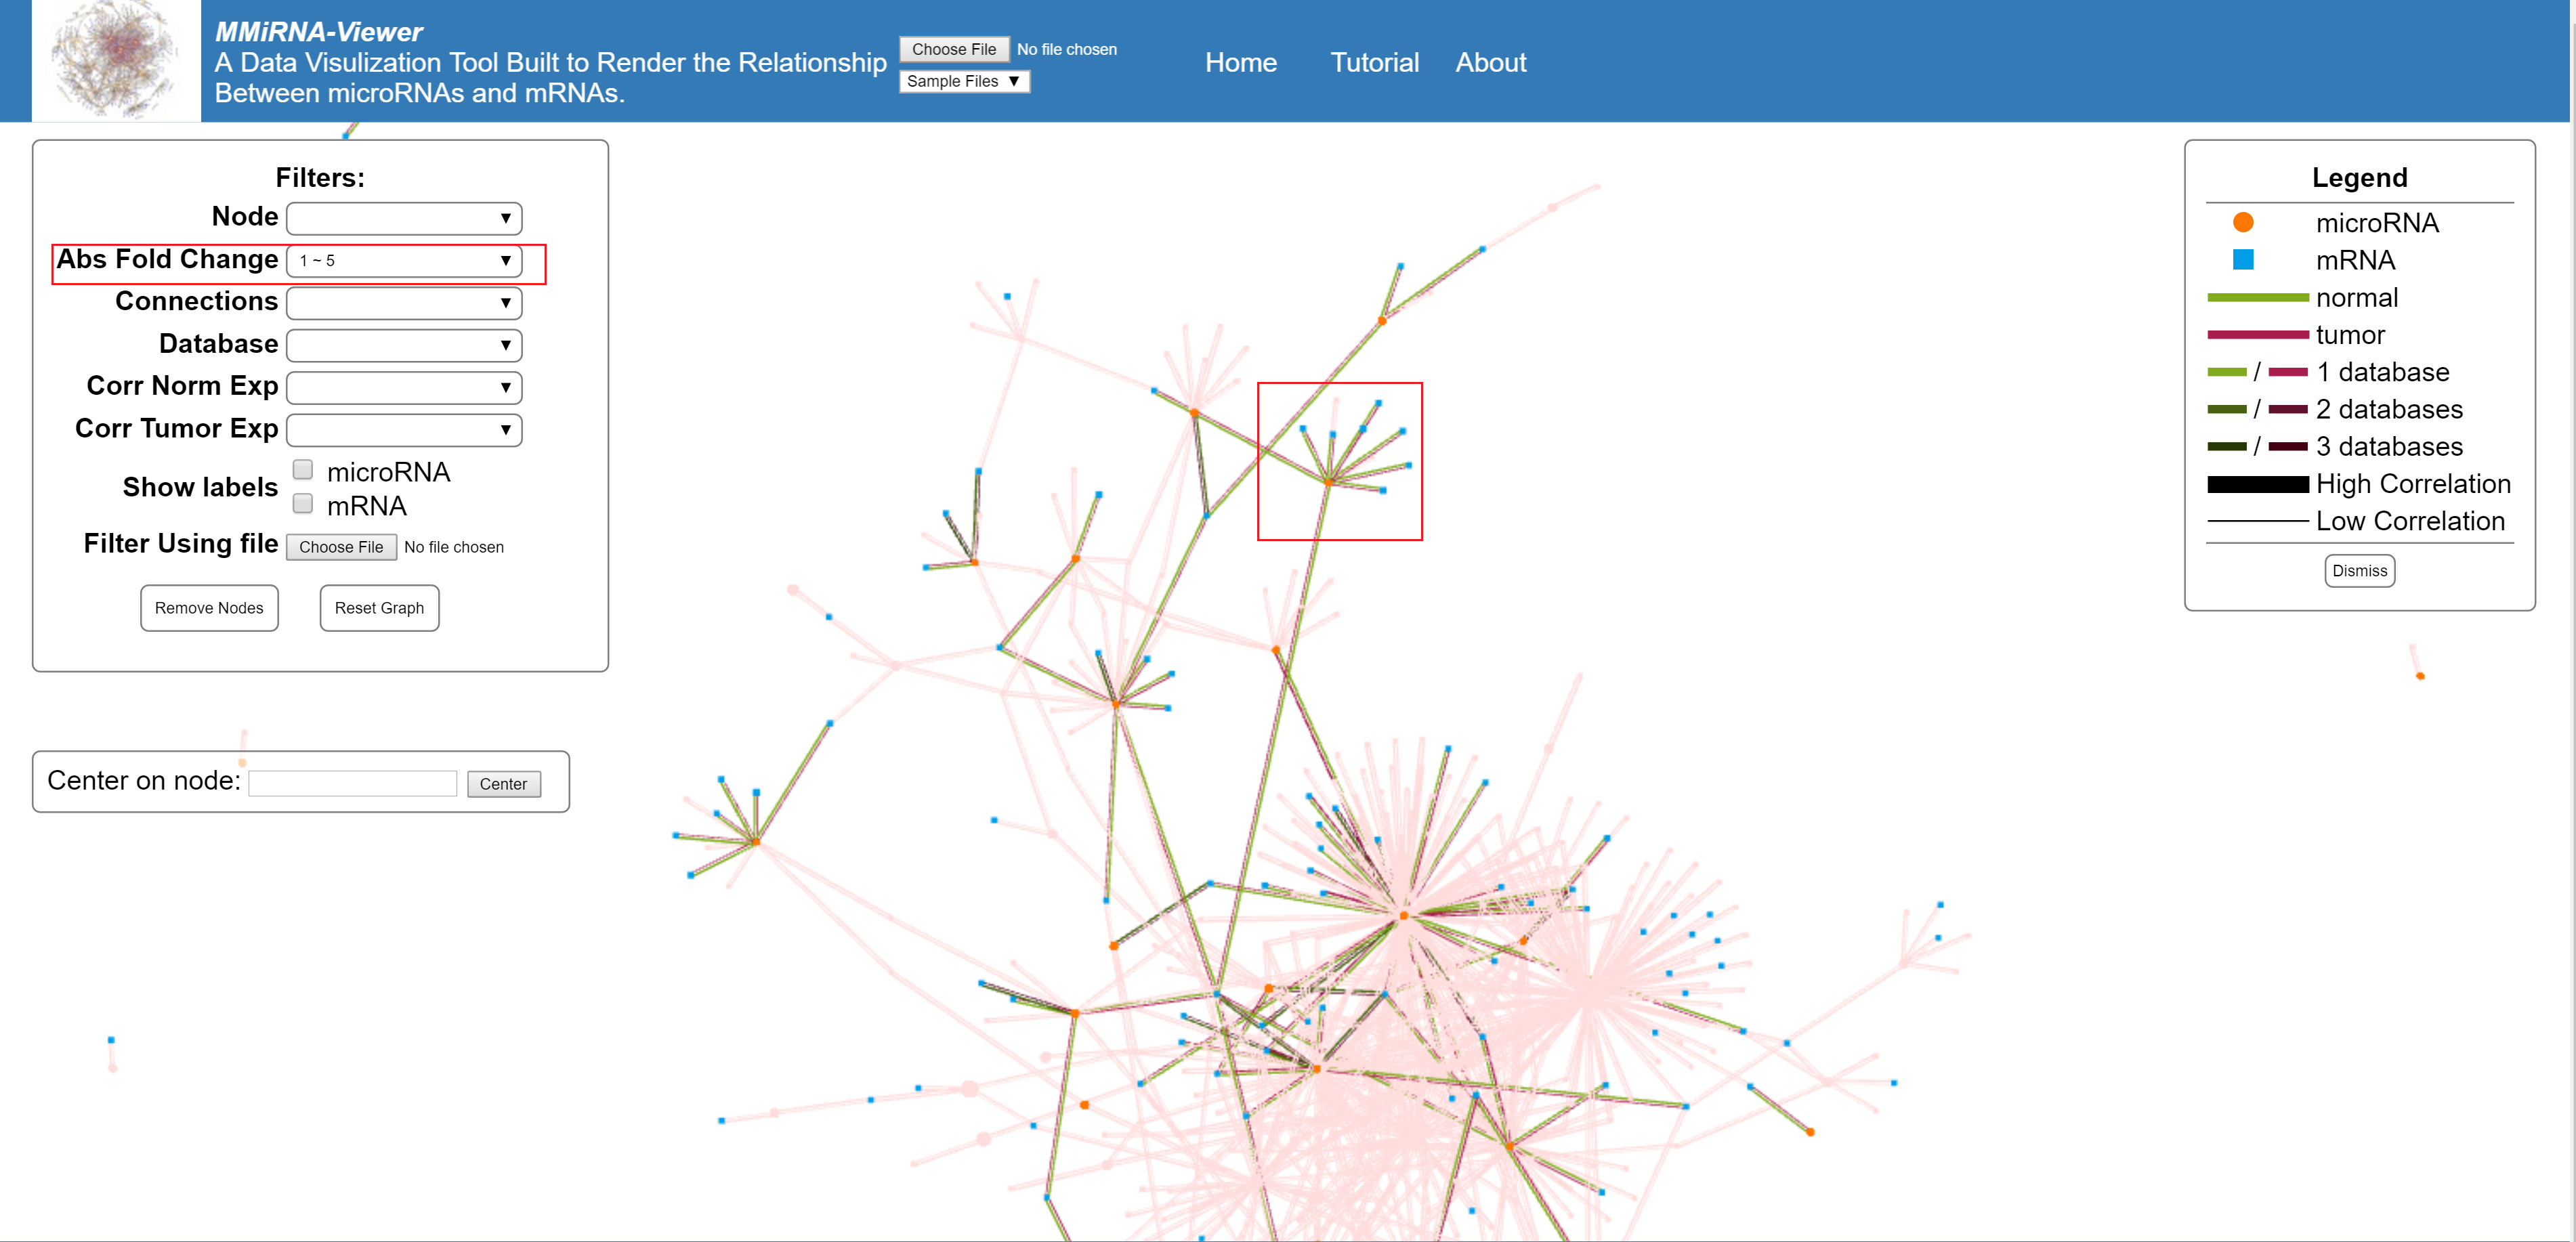
Filter by the absolute vale of the fold change of the nodes.
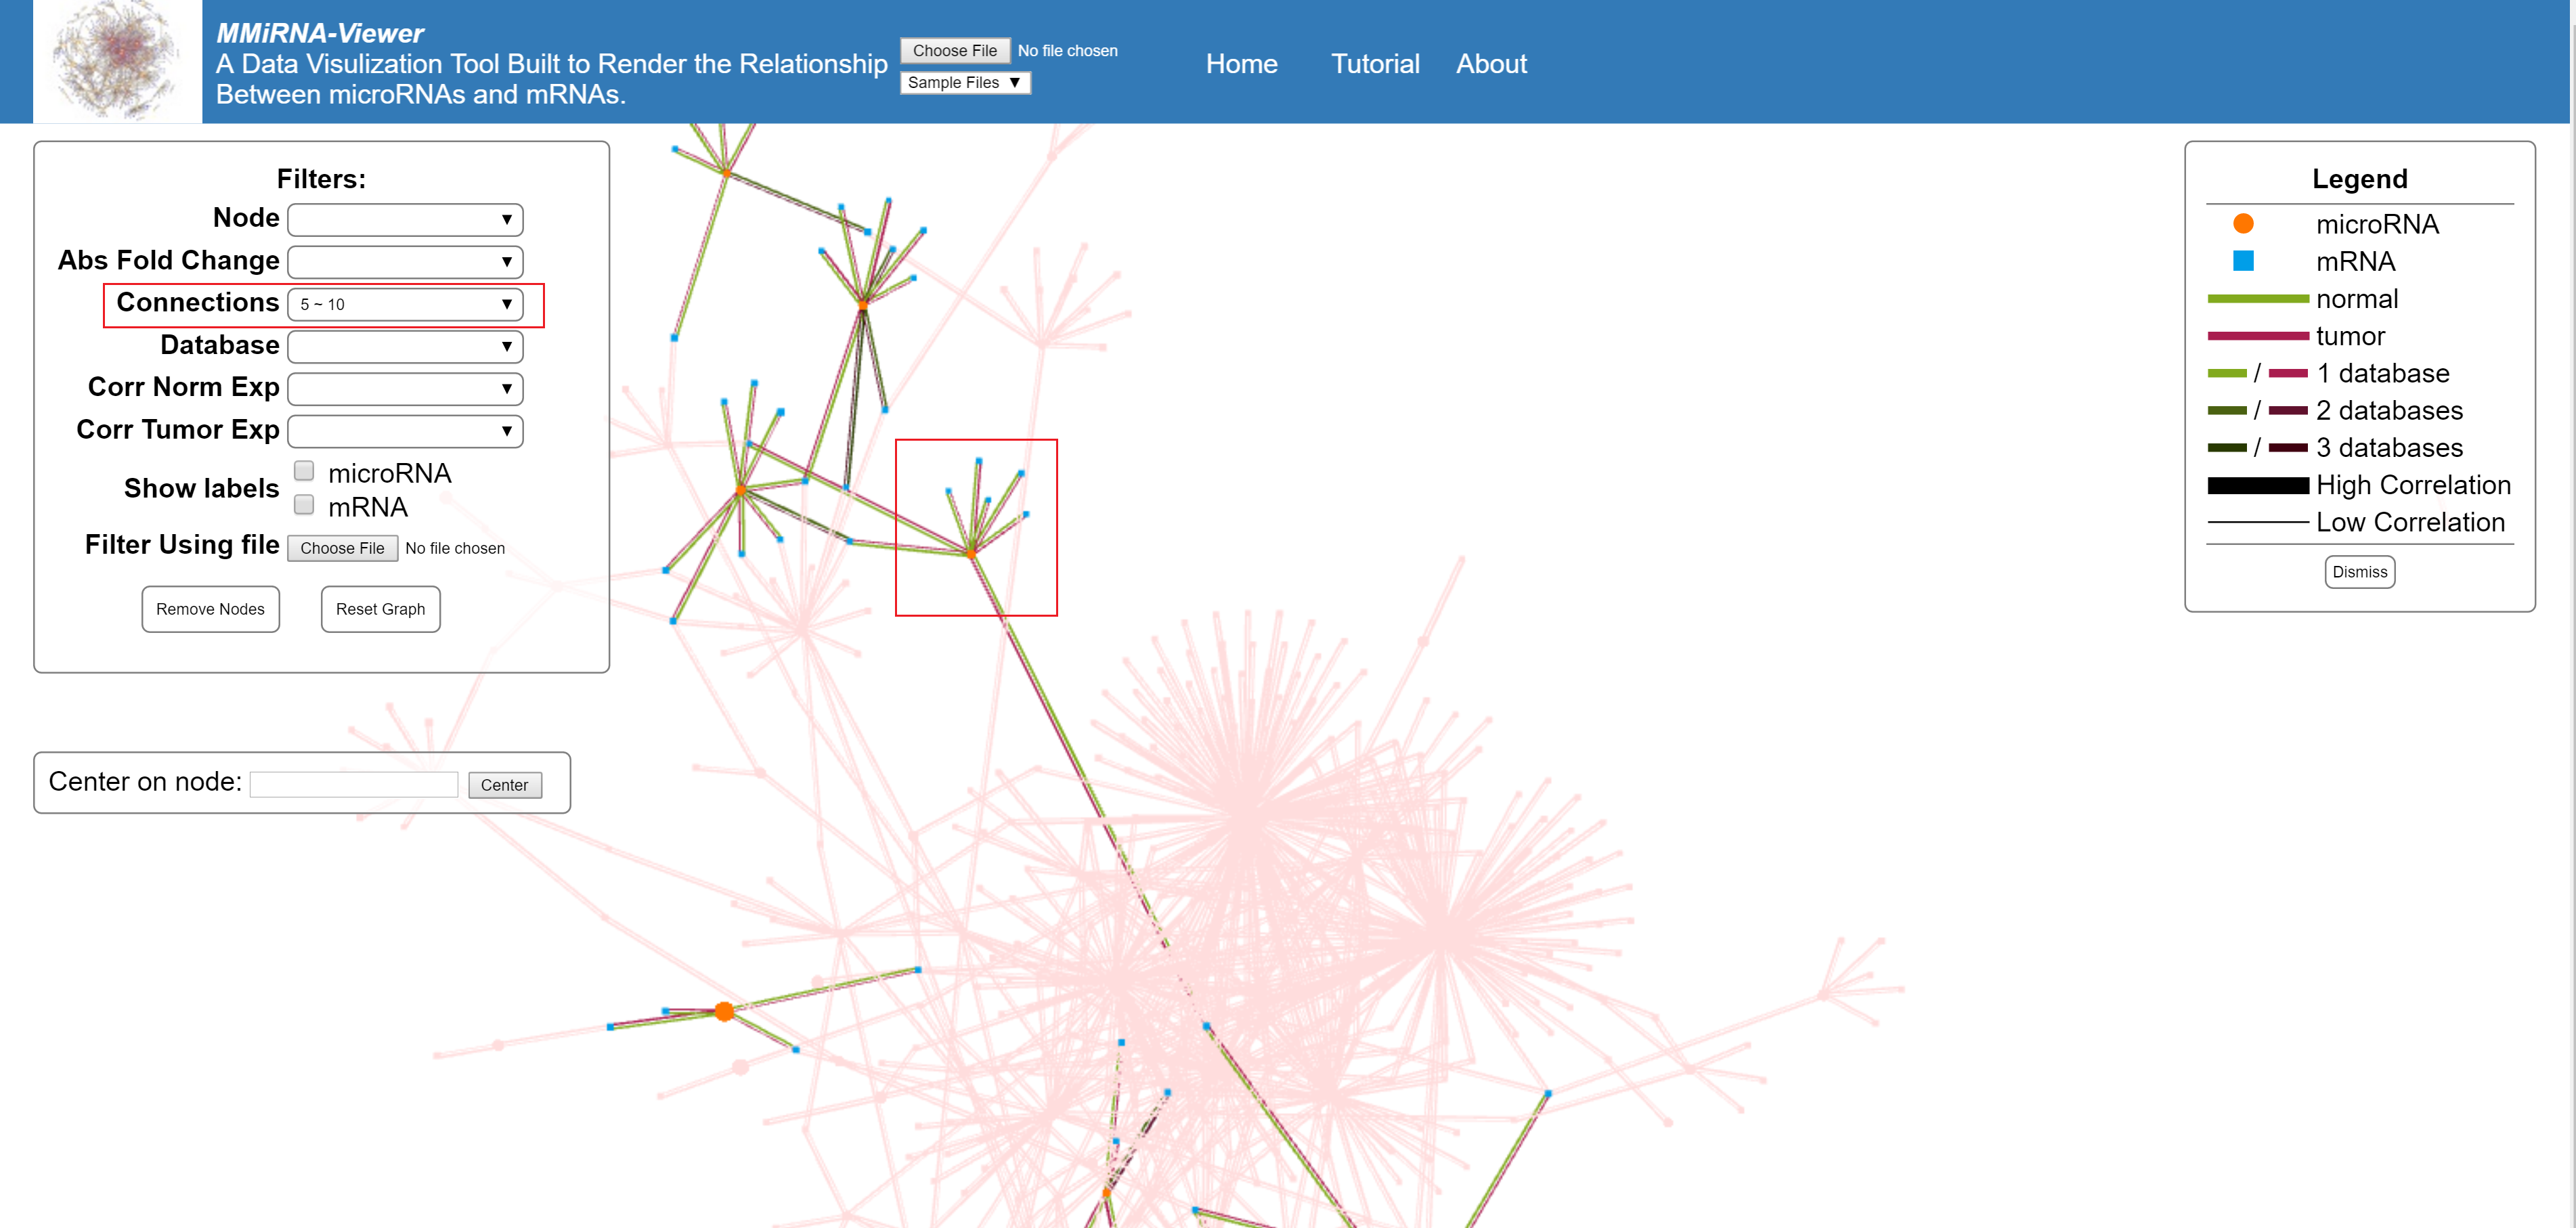
Filters by number of connections made by a single node.
Filter by the number of database predictions.
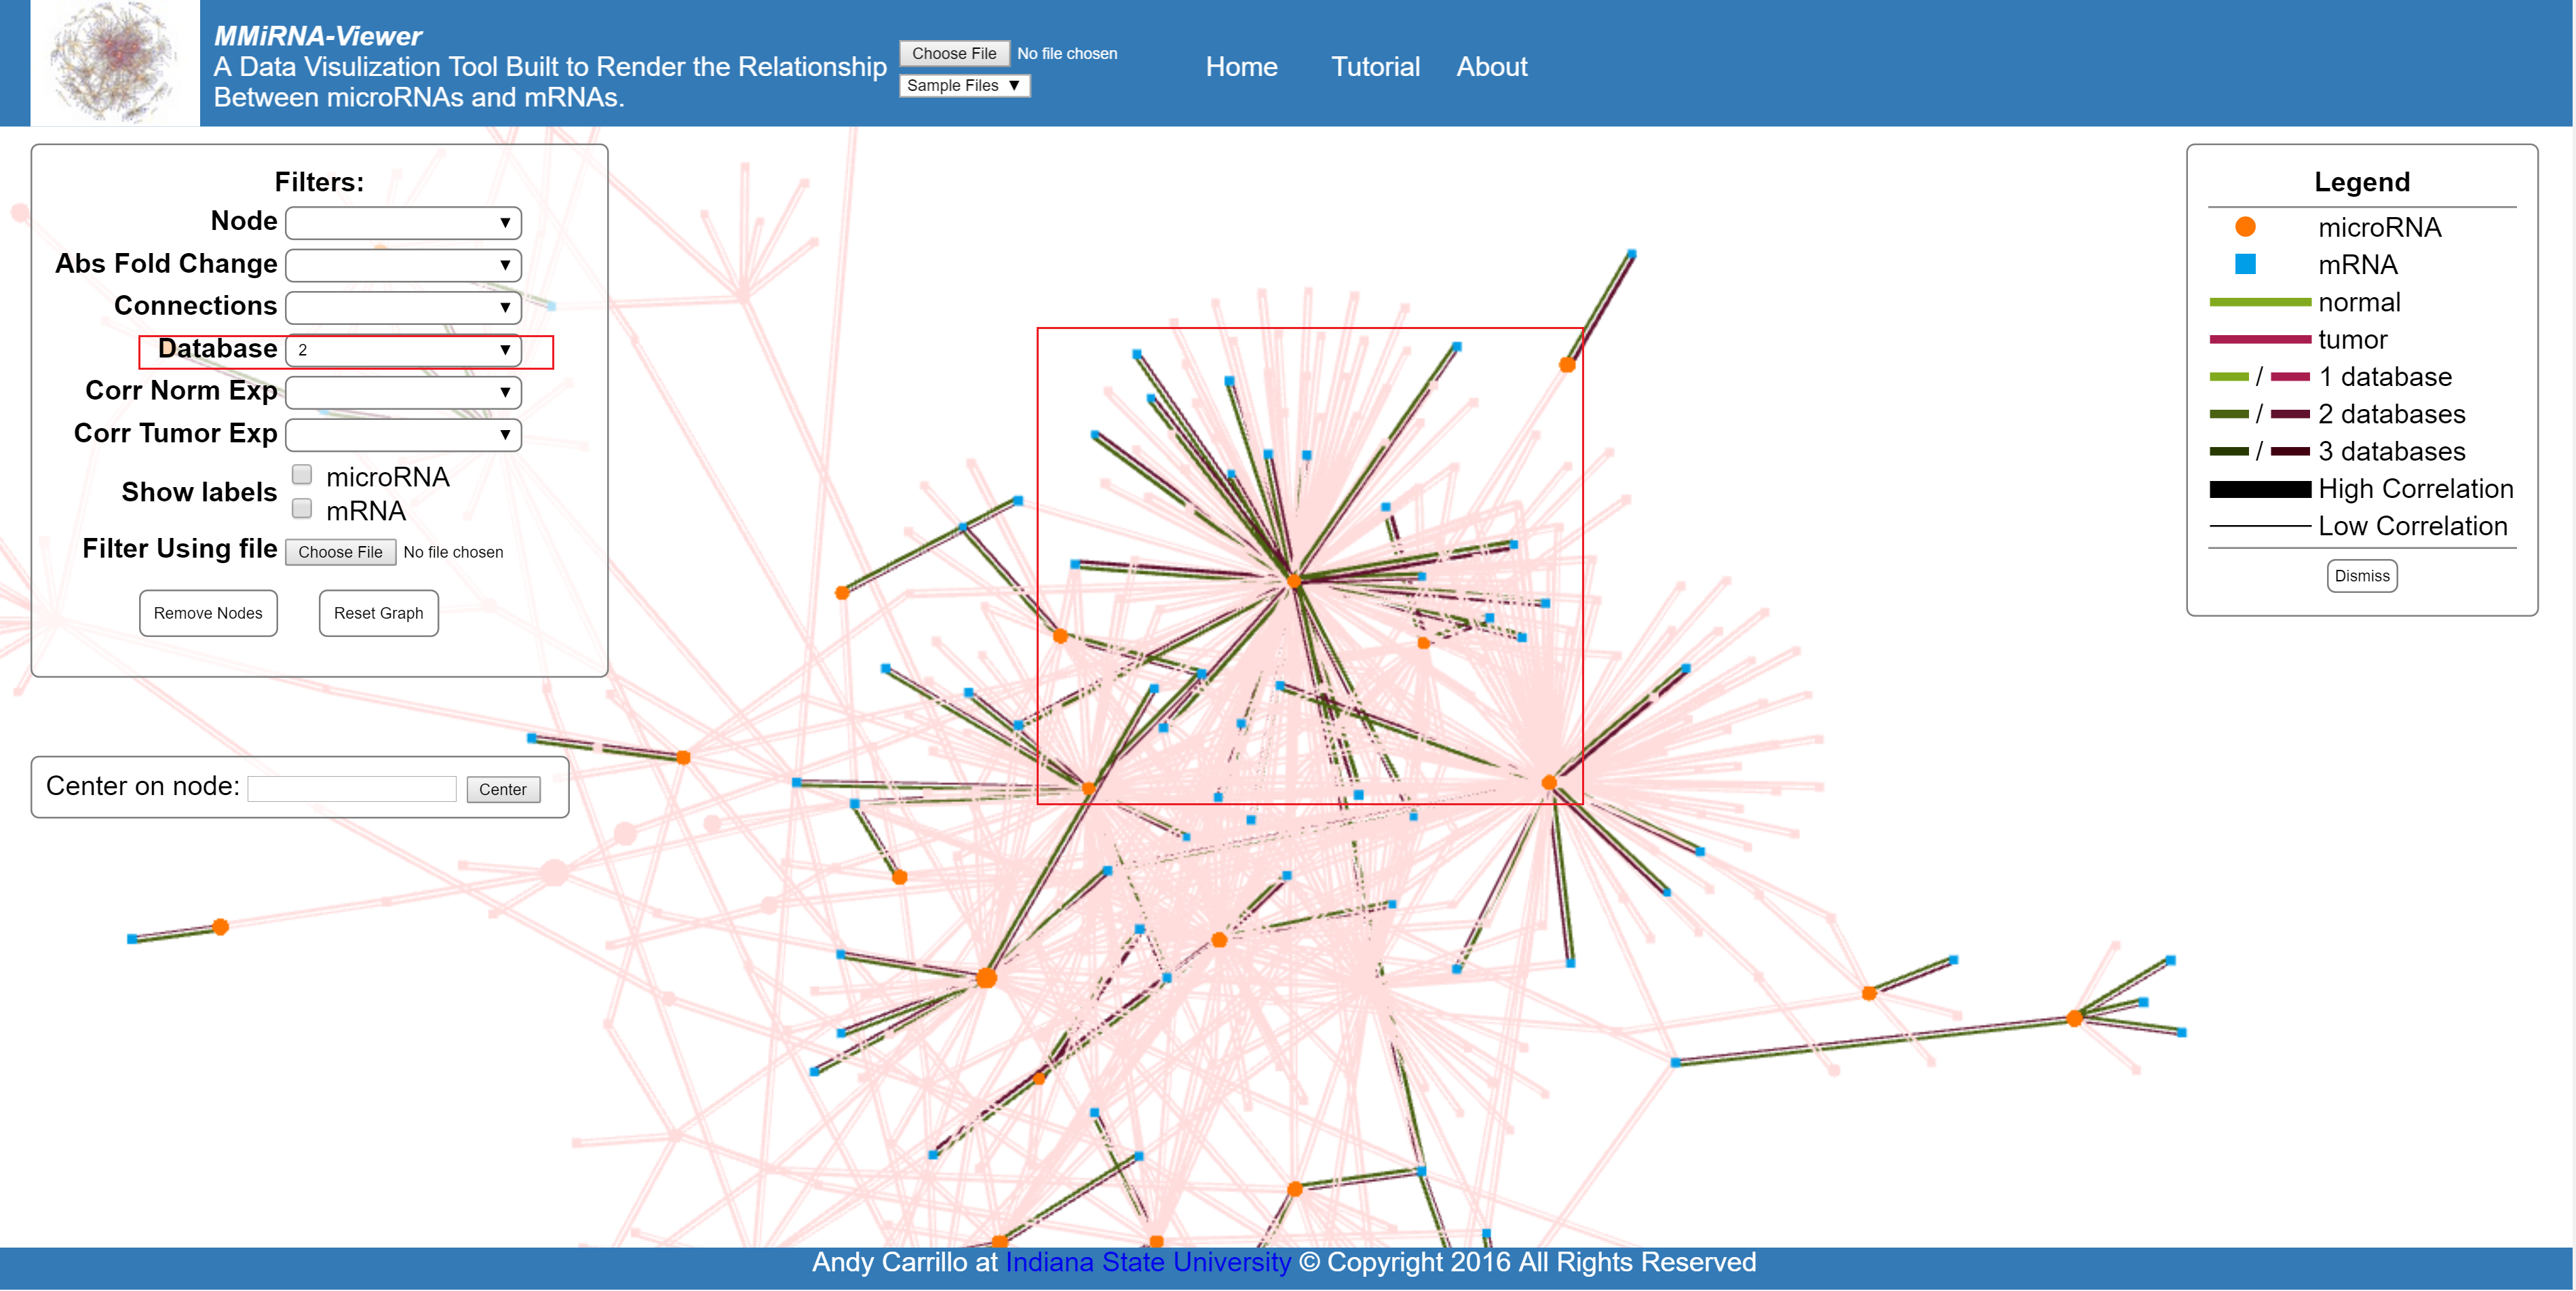
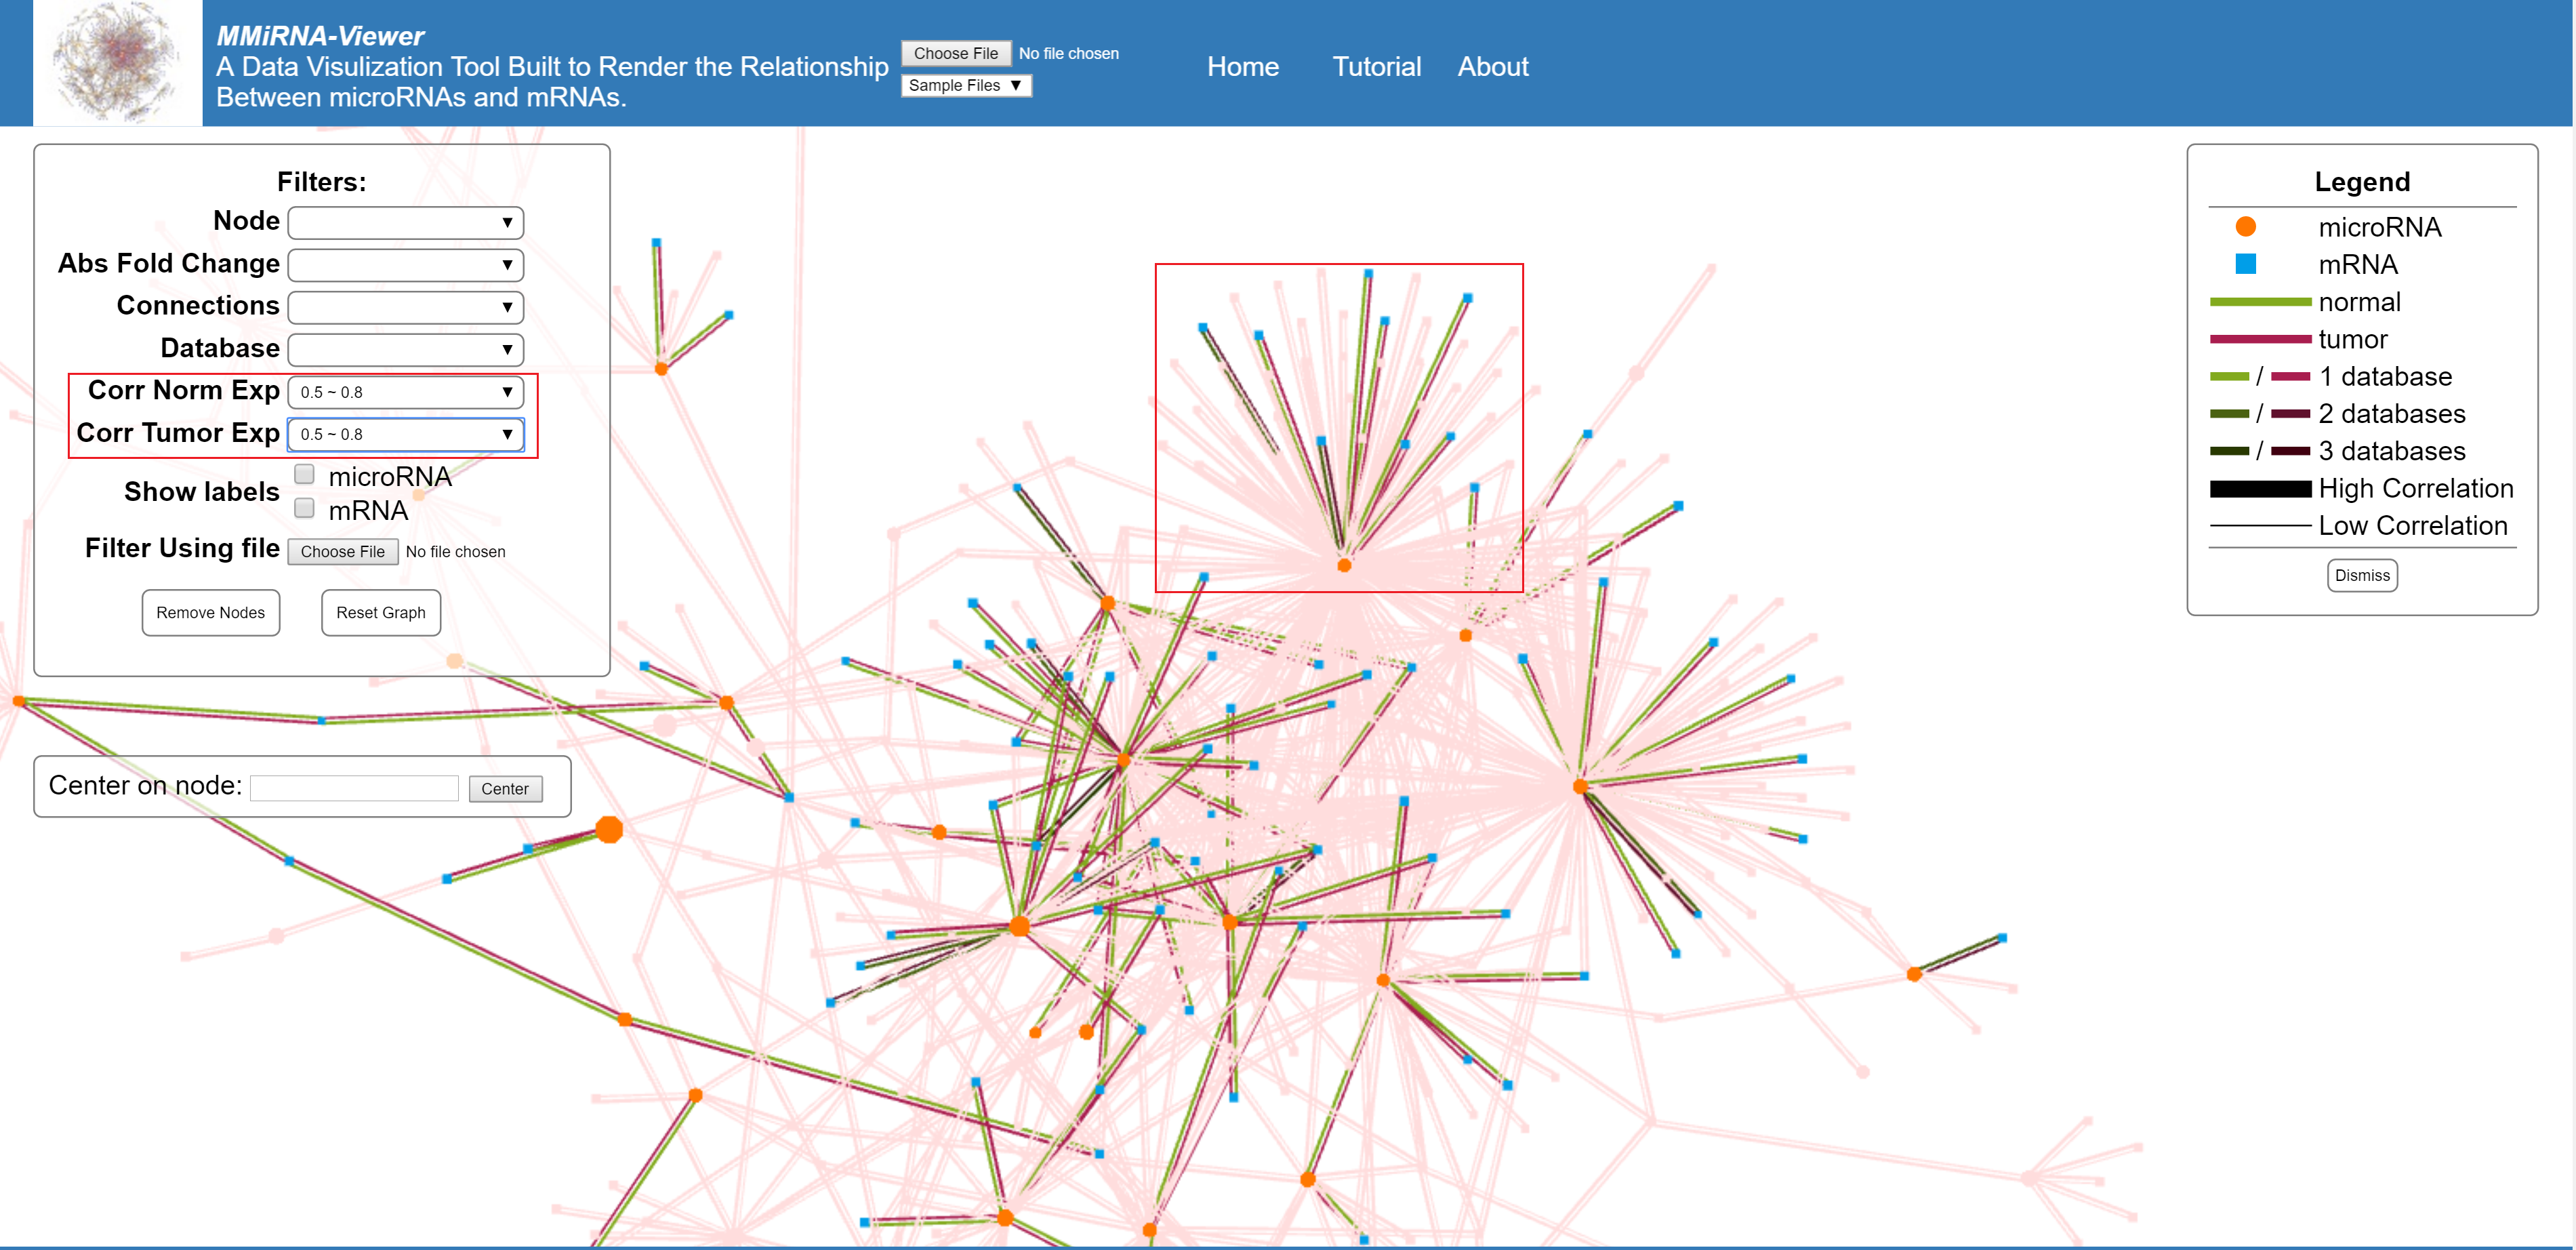
Filter based on the correlation of either the tumor (experimental) or the normal (control) data.
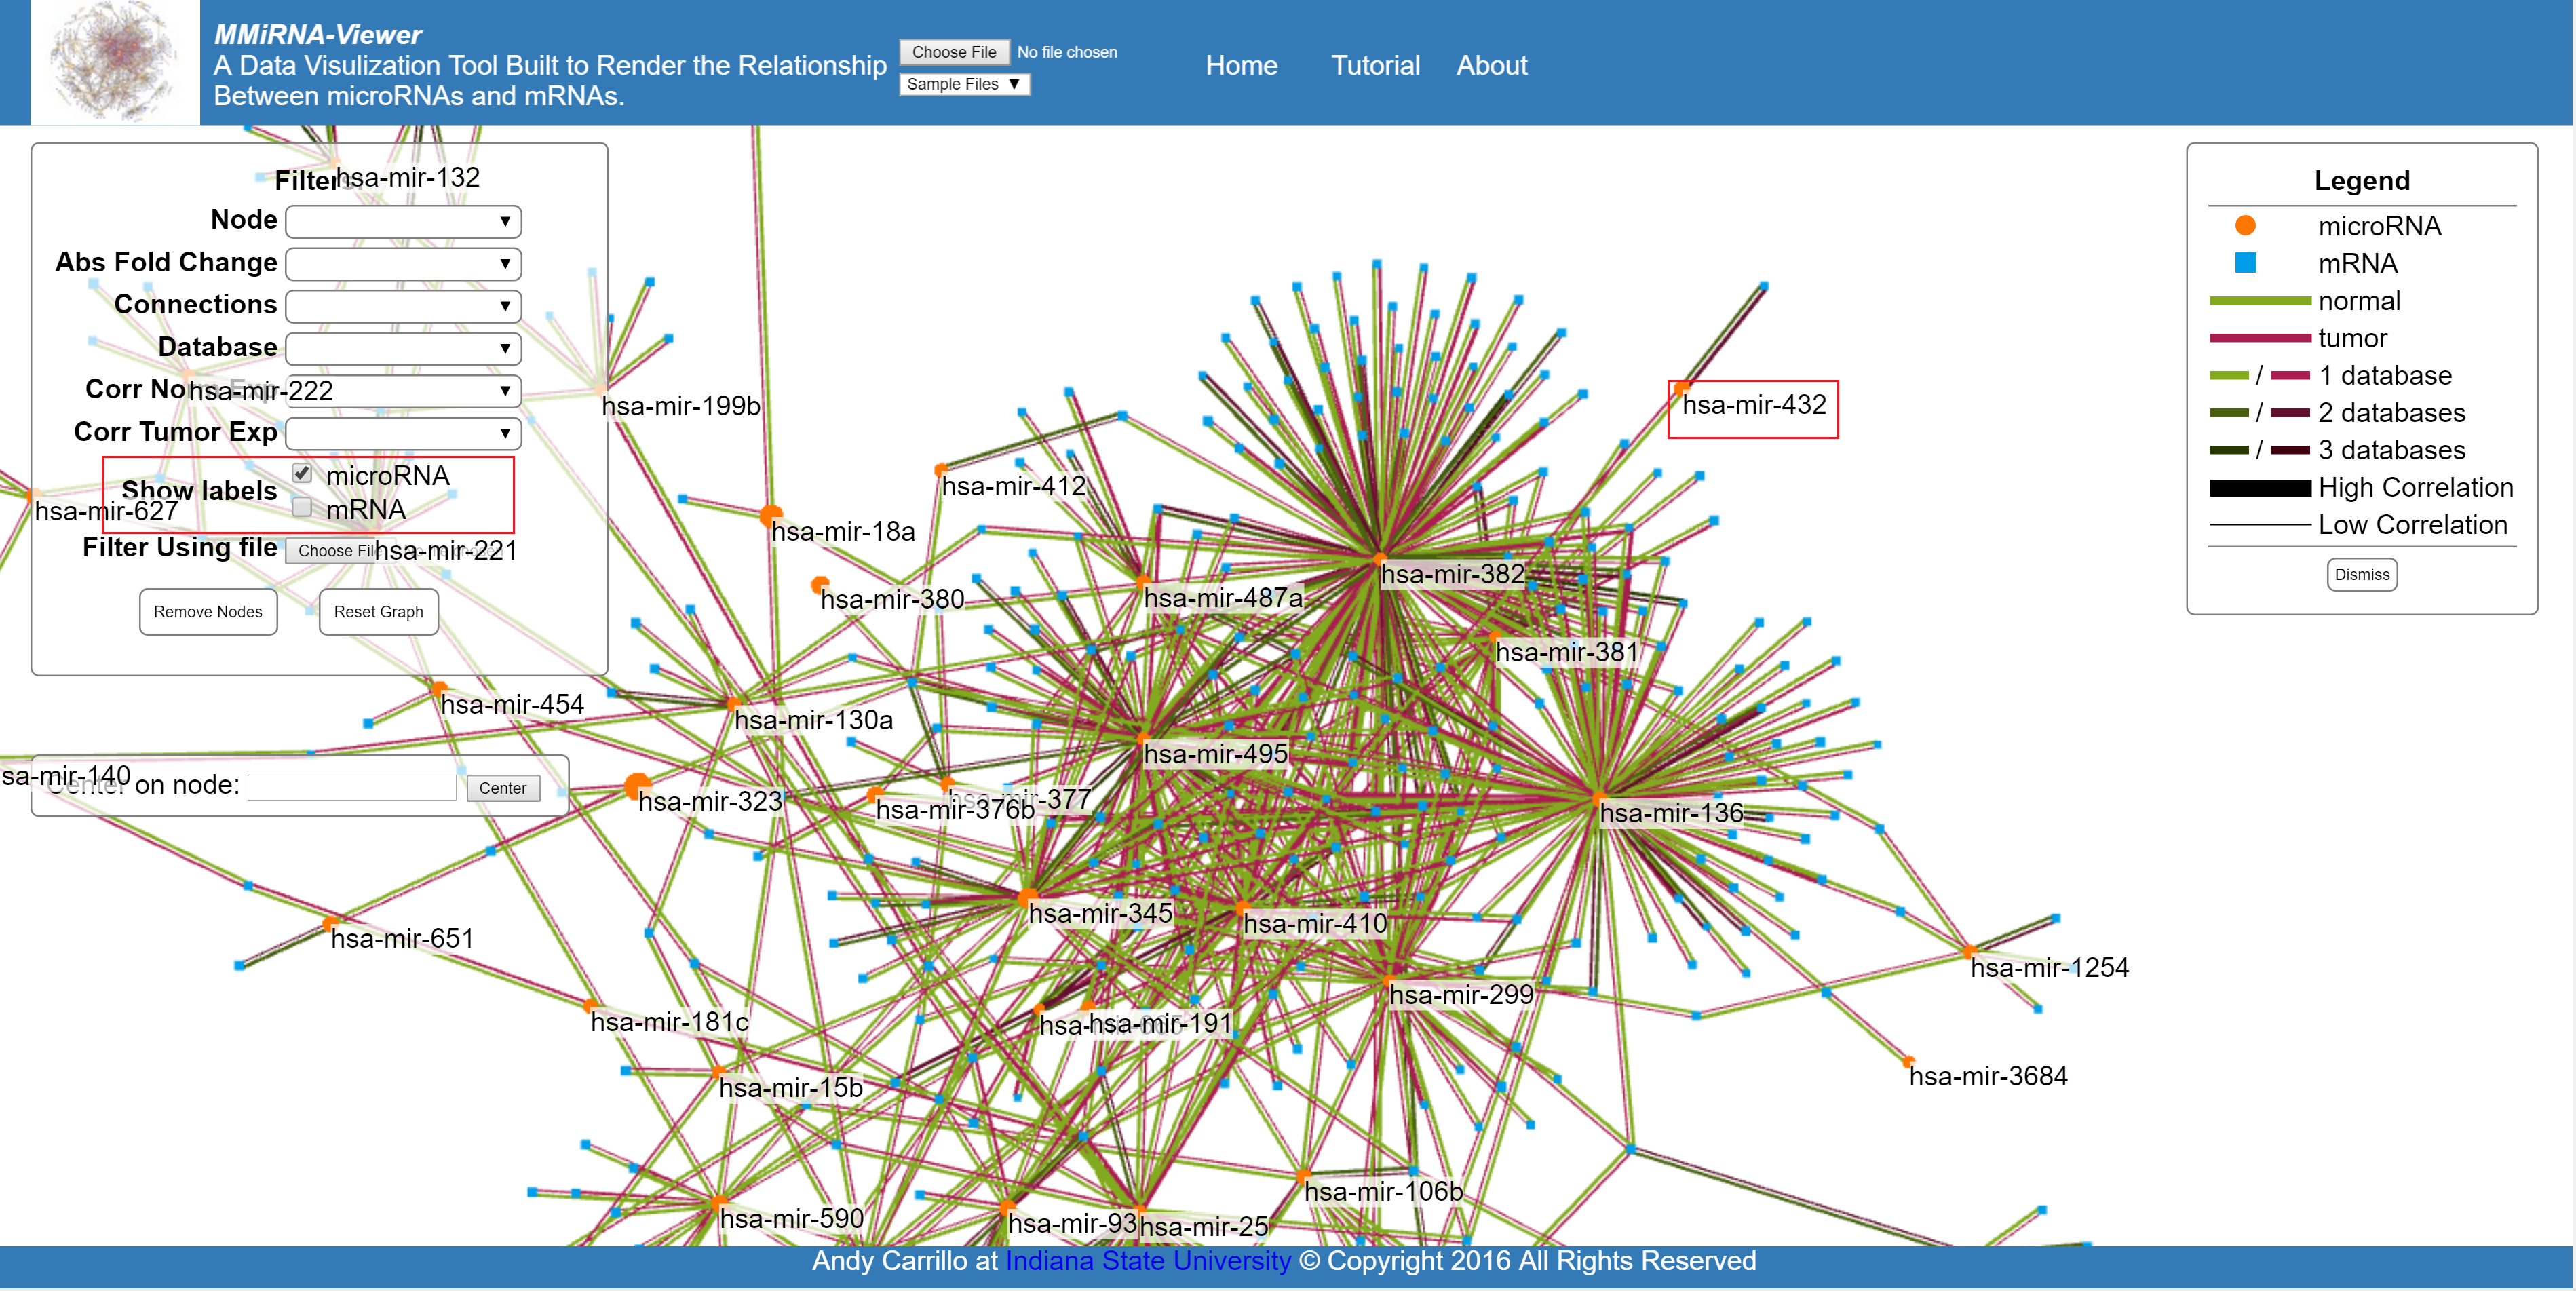
Show the geneIDs or the names of the miRNA names of all nodes currently displayed.
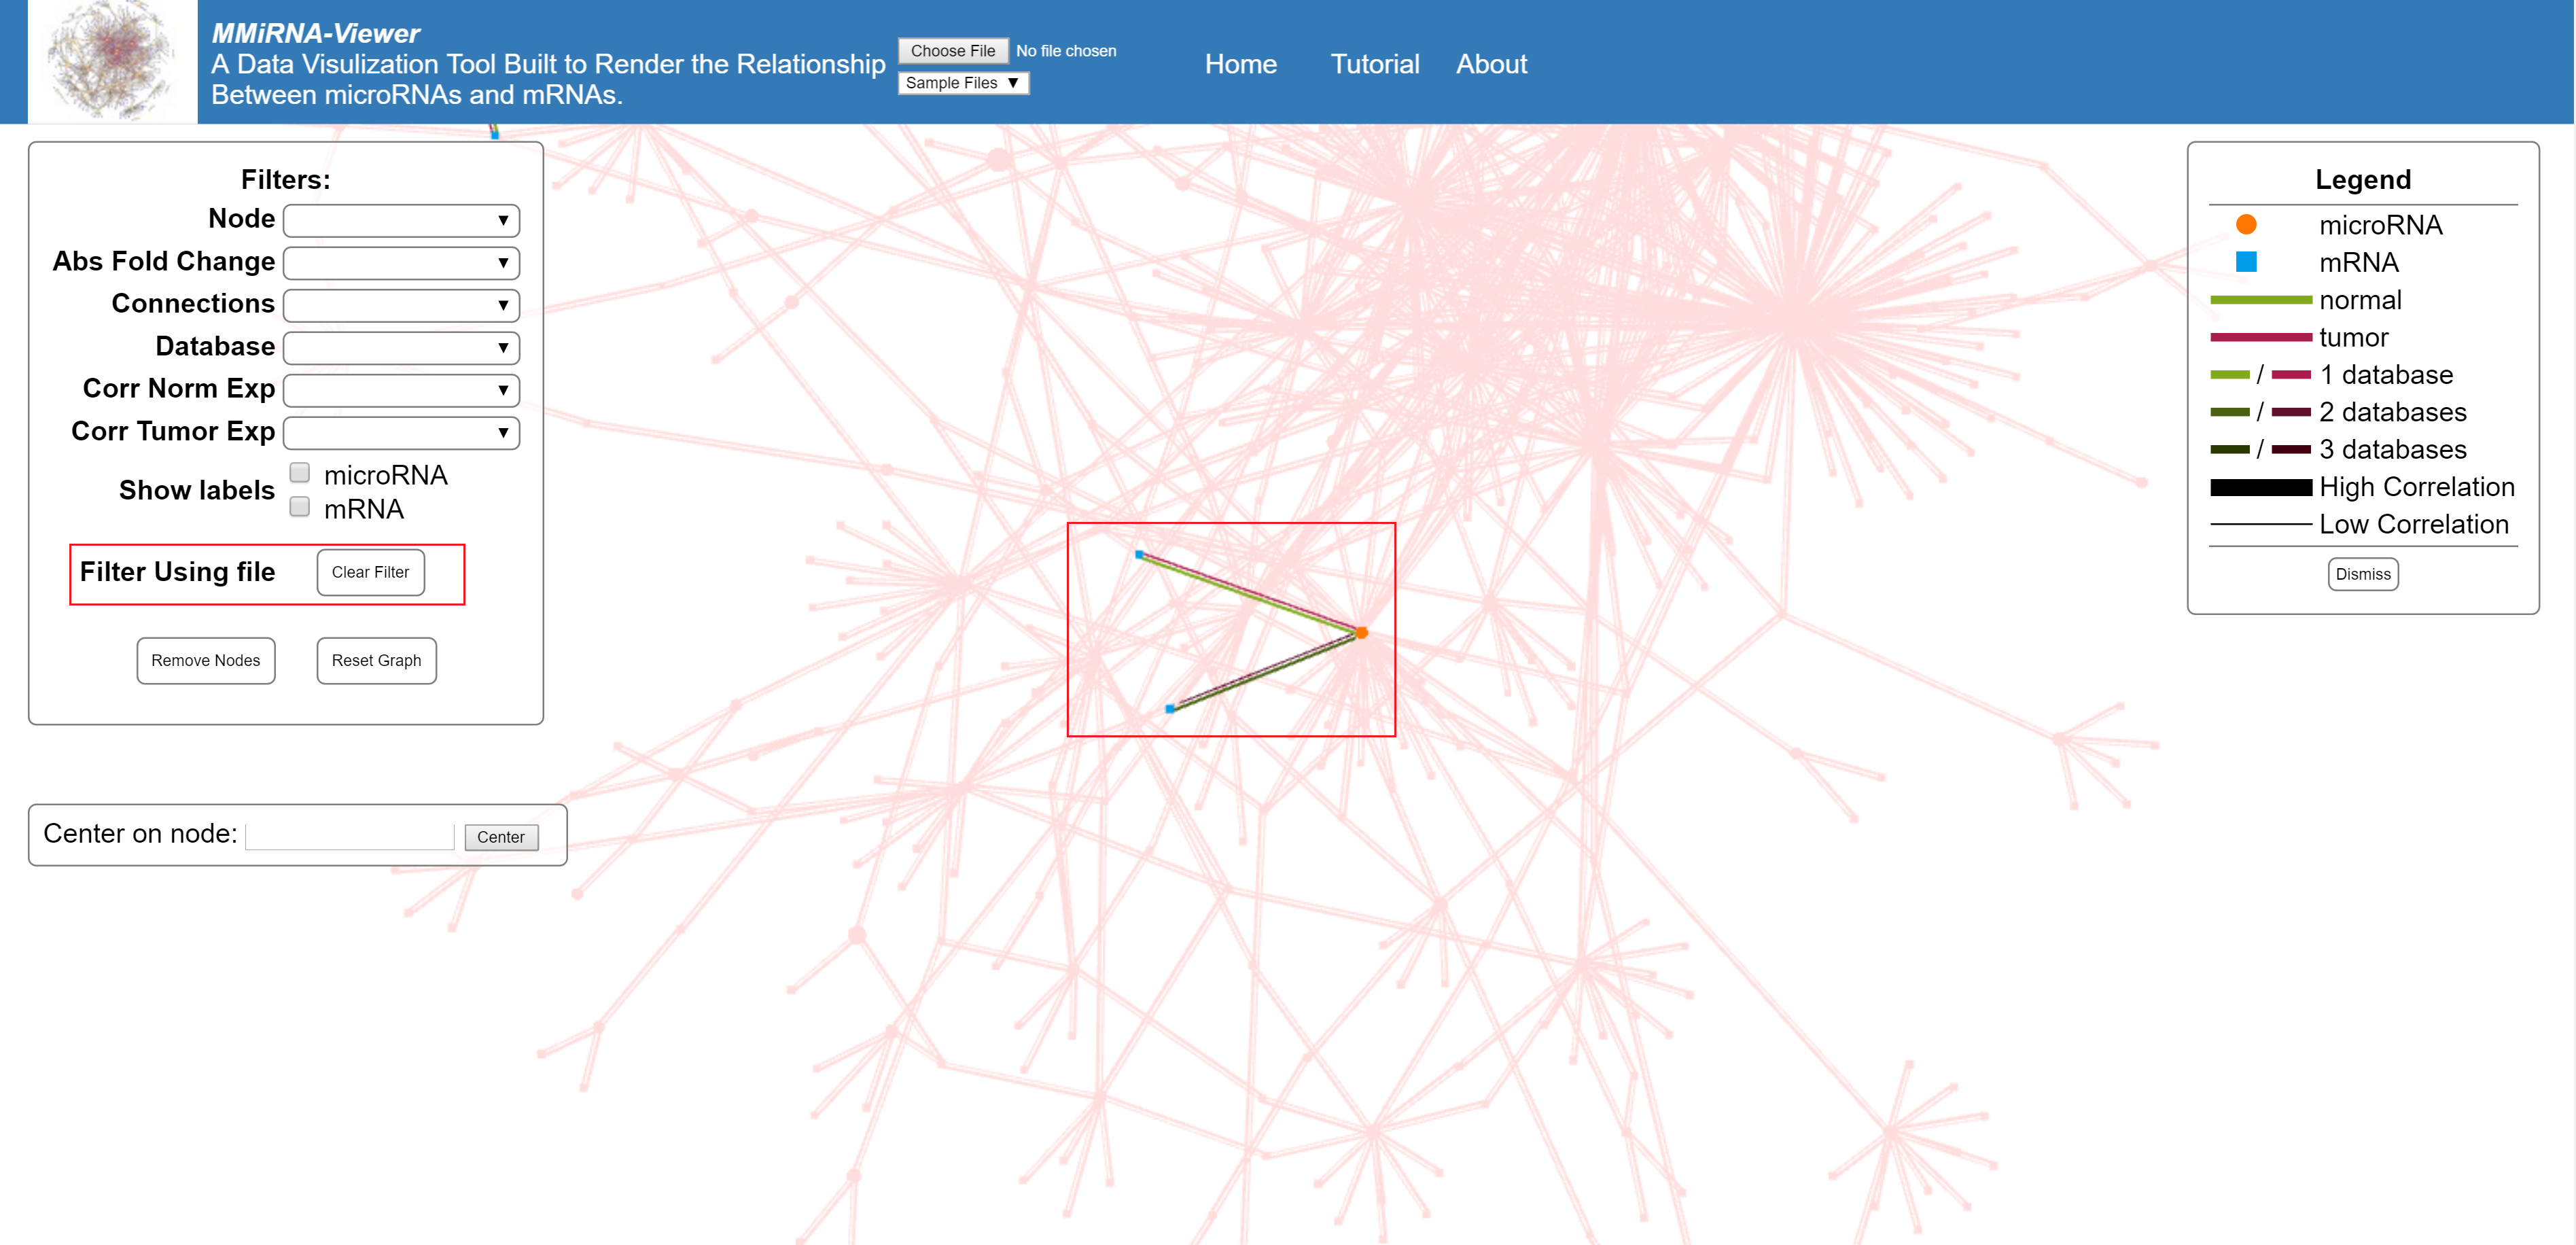
Display all nodes shared by the first file with the selected file.
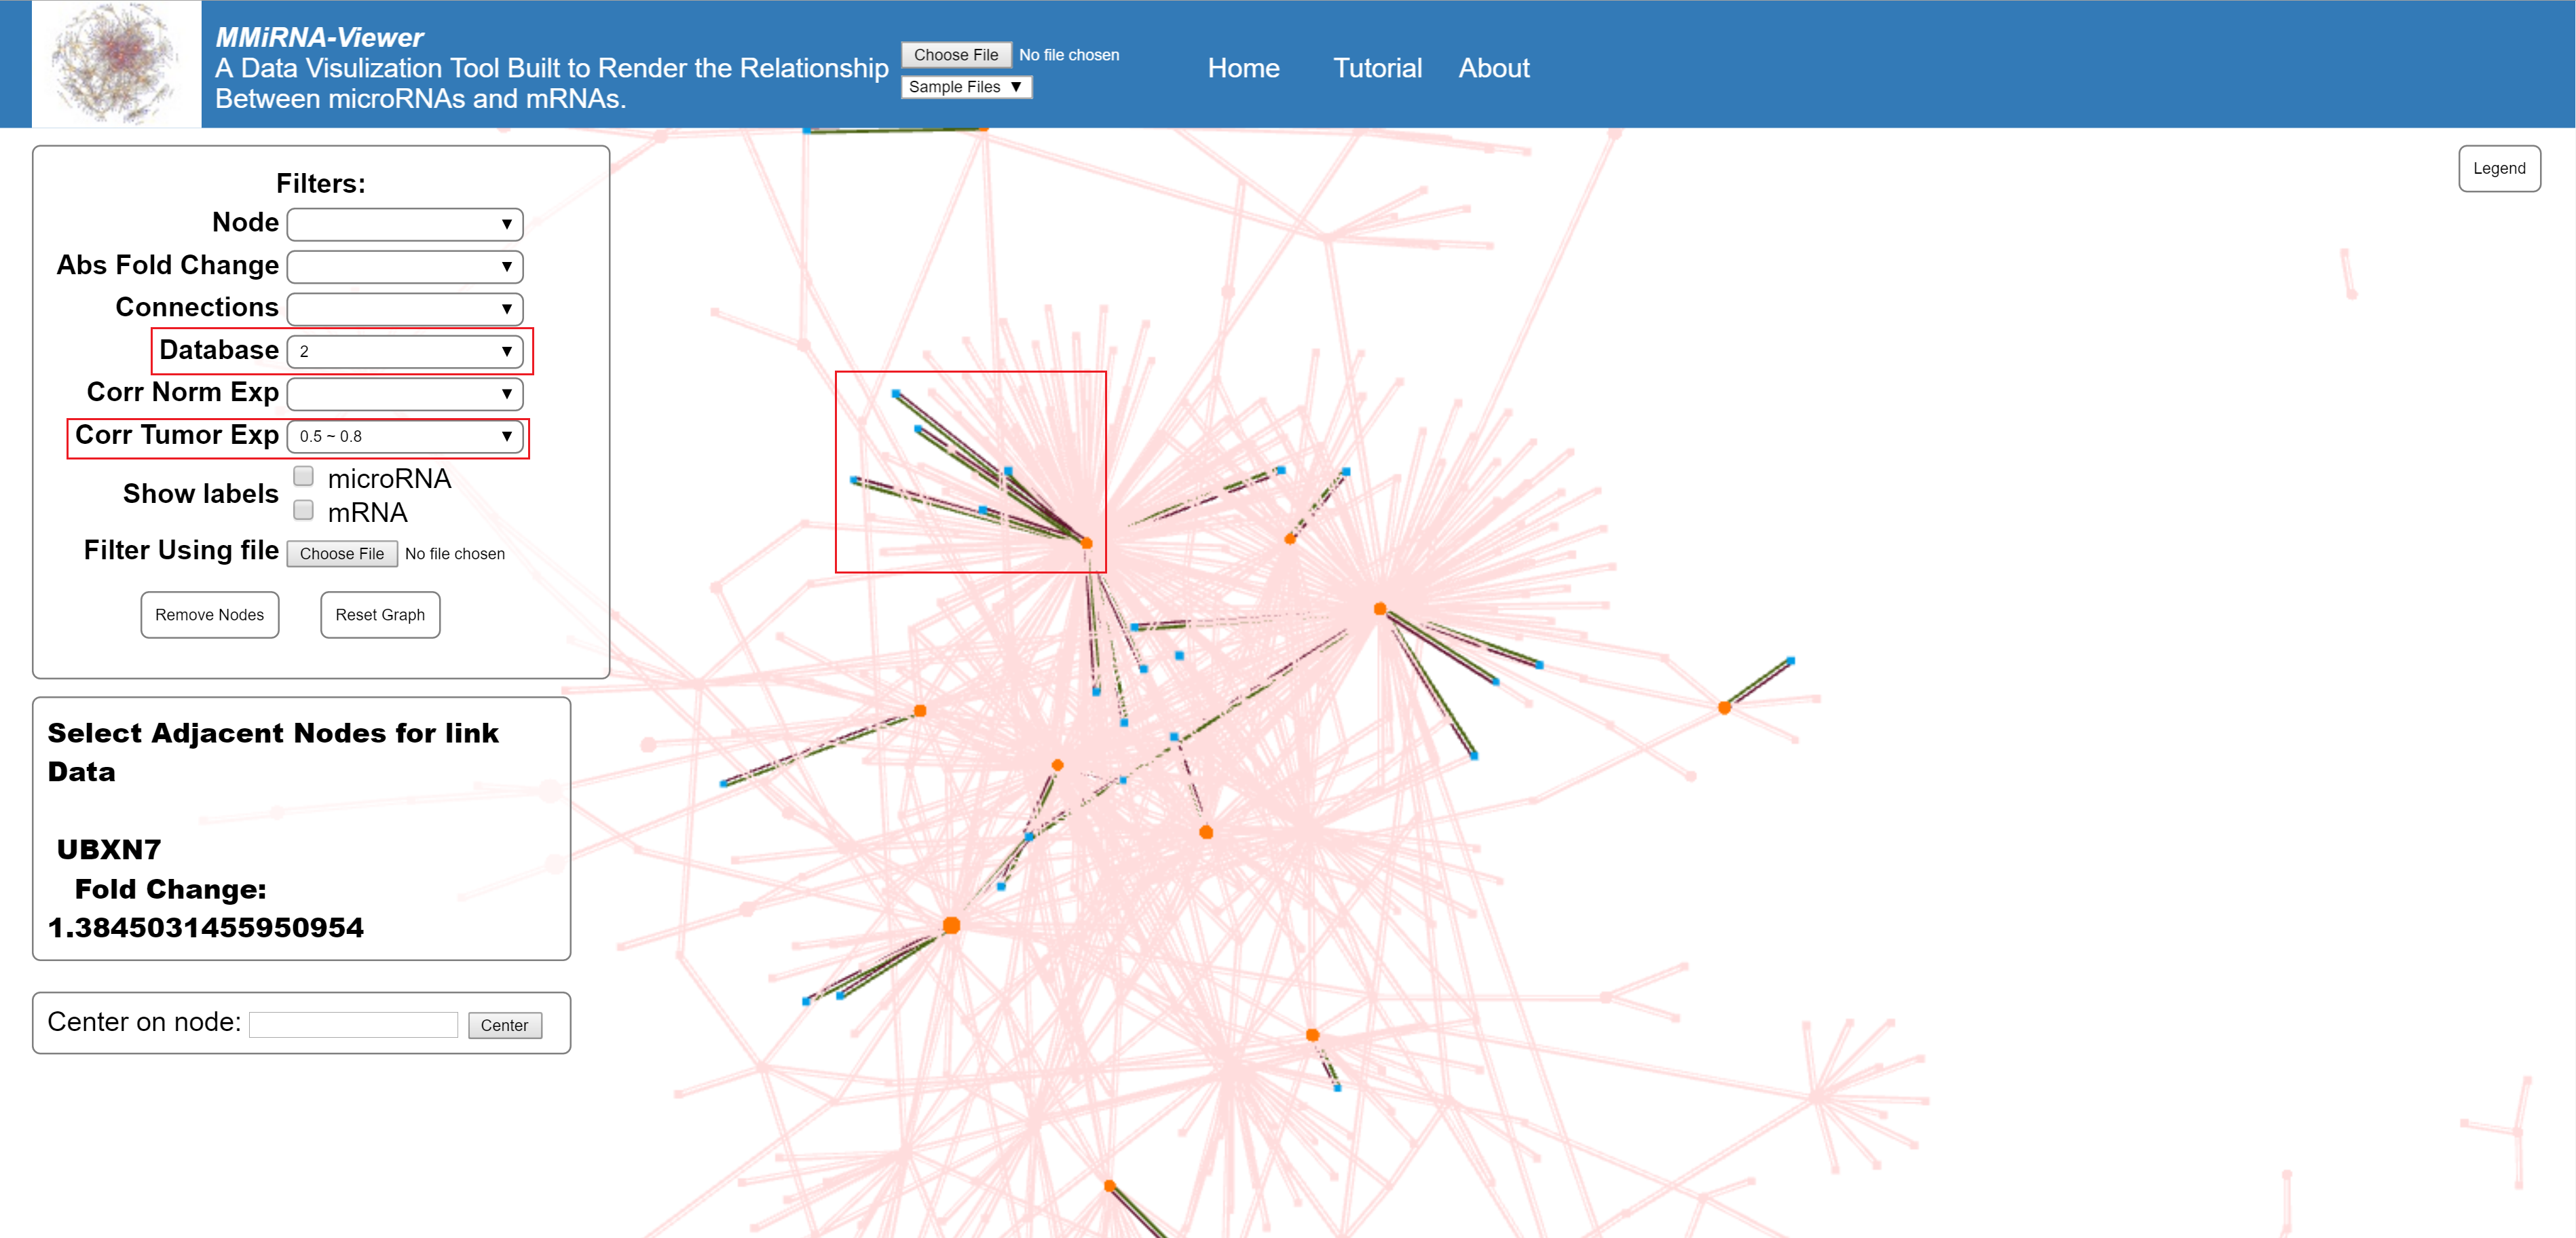
Multiple filters can be applied at the same time.